Concepts in Analytics & Metrics, page 6
Regression Discontinuity Design (RDD)
RDD finds a natural experiment at a cutoff point, like a test score threshold for a scholarship. By comparing people just above and below the score, you can estimate the program's effect. The footgun is assuming this local effect applies to everyone.
Instrumental Variables: Isolating True Cause and Effect
Instrumental Variables (IV) isolate true causality when a key variable is tainted by hidden factors. An IV is a "clean" substitute that influences your cause without directly touching your effect, letting you measure the true relationship, free from…
Propensity Score Matching: Mimicking an A/B Test
Propensity Score Matching (PSM) mimics a randomized trial with observational data by finding a "statistical twin" for each subject. It's used to estimate a feature's impact when a true A/B test isn't possible. The footgun is assuming it removes all bias.

Moving Average: Smoothing Out the Noise in Data
A moving average smooths out noisy data by replacing each point with the average of its neighbors, revealing the underlying trend. It's used to track stock prices or server metrics without overreacting to short spikes.

Training vs. Test Sets: Judging a Forecast's True Accuracy
Don't judge a forecast by how well it fits the data it was trained on. To measure true accuracy, split your data into a training set for model fitting and a test set for evaluation, using data the model has never seen before.
Stationarity: A Time Series's Stable Personality
A time series is stationary if its statistical personality, like its average and spread, remains constant over time. Many forecasting models require this stability to work correctly.
Exponential Smoothing: Weighting Recent Data More Heavily
Exponential smoothing creates forecasts from a weighted average of past data, where weights decay exponentially for older points. It's used for quick, reliable predictions like inventory demand. The footgun: simple versions ignore trends and seasonality.
Holt-Winters Exponential Smoothing
Forecast time-series data by giving more weight to recent events. Holt-Winters smoothing is used to analyze metrics and make predictions by accounting for user-defined assumptions like seasonality.
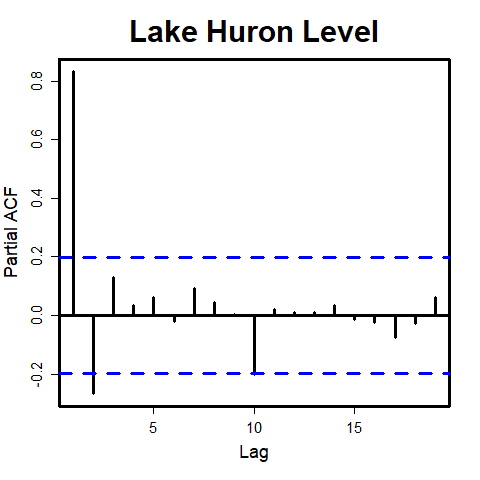
ACF vs. PACF: A Time Series Signal and Its Echo
Autocorrelation (ACF) measures a time series's total correlation with its past, including indirect echoes. Partial Autocorrelation (PACF) isolates the direct correlation by removing intermediate effects. They help select forecasting model parameters.
Time Series Cross-Validation
Unlike standard cross-validation that shuffles data, time series cross-validation respects the arrow of time. It evaluates a forecasting model by training only on past data to predict a future point, then rolling forward. The footgun is using random k-folds.

Prophet: Automated Time Series Forecasting
Prophet treats forecasting like decomposing a signal, breaking a time series into trend, seasonality, and holiday effects. It excels at predicting business metrics with strong seasonal patterns, like web traffic.
ARIMA: Forecasting by Modeling Autocorrelation
ARIMA models forecast a time series by learning its "memory"—how past values influence the next. It's used for forecasting sales or server load where patterns are driven by internal dynamics.

Granger Causality: Forecasting, Not Causing
Granger Causality tests if one time series can forecast another, not if it causes it. It's used in econometrics to see if money supply changes predict inflation. The footgun is the name itself: it only shows predictive power, not true cause-and-effect.

LSTMs: Giving Neural Networks a Long-Term Memory
LSTMs give neural networks a selective memory, letting them remember important information over long sequences. This is key for language translation or time-series forecasting where old context matters.
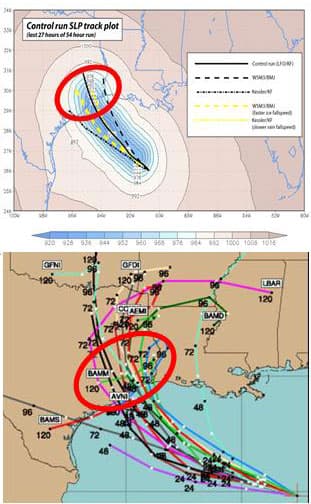
Ensemble Forecasting: Predicting with a Crowd of Models
Instead of one 'best guess,' ensemble methods generate many forecasts to map the range of possibilities. This is crucial for complex systems like weather prediction, where a single model is misleadingly precise.
Customer Acquisition Cost: What It Costs to Win a Customer
Customer Acquisition Cost (CAC) is the total price you pay in sales and marketing to get one new customer. Businesses use it to see if their model is viable by comparing it to customer lifetime value (LTV). The footgun is forgetting to include all costs.
MRR: The Subscription Heartbeat
MRR is the monthly pulse of a subscription business. SaaS teams use it to forecast growth and measure churn. Counting one-time fees or annual contracts without proration inflates the metric and misleads stakeholders.
Net Promoter Score (NPS): A Snapshot of Customer Loyalty
NPS distills customer loyalty into one number by asking, "How likely are you to recommend us?" It's a quick pulse check for product teams. The footgun is treating the score as a diagnosis; it tells you *what* customers feel, but not *why*.

Customer Retention Rate: Your Leaky Bucket Metric
Customer Retention Rate measures how many customers you keep over a period, showing how "leaky" your business's bucket is. It's vital for subscription services and e-commerce to gauge loyalty and predict revenue. A high overall rate can hide dangerous churn.
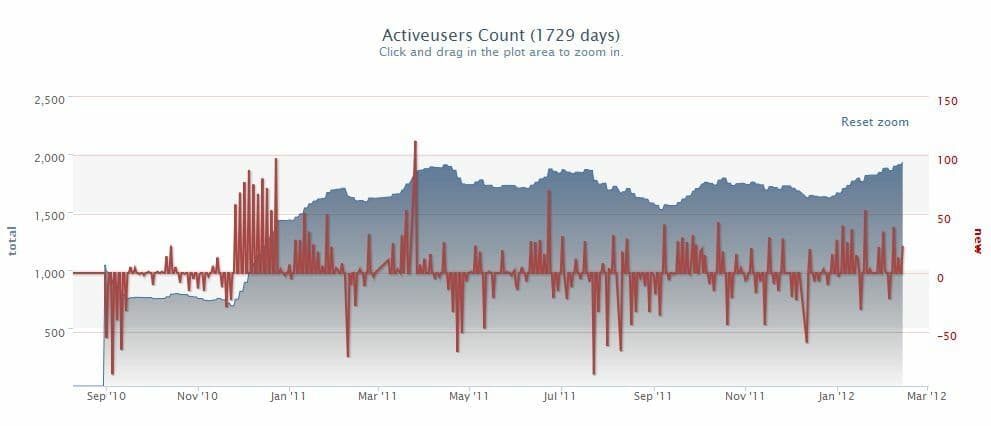
DAU/MAU Ratio: Measuring Product Stickiness
The DAU/MAU ratio measures product stickiness by comparing daily to monthly users. Social media apps aim for high ratios (50%+), while e-commerce expects lower ones. The footgun is comparing ratios without context; a 'good' number varies by product type.
We are hiring for this. Every open role lists the topics its interview covers, so you can prepare for the real thing rather than guessing.
See open roles