Easy interview questions in Analytics & Metrics, page 3
What does a p-value of 0.03 mean in an A/B test?
This tests your grasp of statistical significance and ability to make a data-driven decision. A great answer defines p-value, compares it to alpha (0.03 < 0.05), and concludes to reject the null hypothesis. A red flag is misstating the p-value's definition.
What does a p-value of 0.03 mean in an A/B test?
Tests your practical statistical literacy. A good answer defines the p-value (3% chance of this result if the null is true), compares it to alpha (0.03 < 0.05) to reject the null, and decides to ship.

Design an A/B test for a 'Buy Now' button color change
Tests structured experiment design from hypothesis to metric. Strong answers: define a falsifiable hypothesis; pick purchase conversion as primary; size the sample and duration; randomize by user; pre-commit to stopping rules.
How would you A/B test a 'Buy Now' button color change?
Tests your grasp of the A/B testing lifecycle. A strong answer defines a clear hypothesis (e.g., 'a green button will increase clicks'), selects a primary metric (CTR), and considers guardrail metrics. A red flag is skipping the hypothesis and metrics.
How would you A/B test a 'Buy Now' button color change?
This tests structured thinking. A good answer defines a hypothesis, selects primary and guardrail metrics, and outlines the experiment's duration and analysis plan. A red flag is focusing only on clicks without considering business impact.
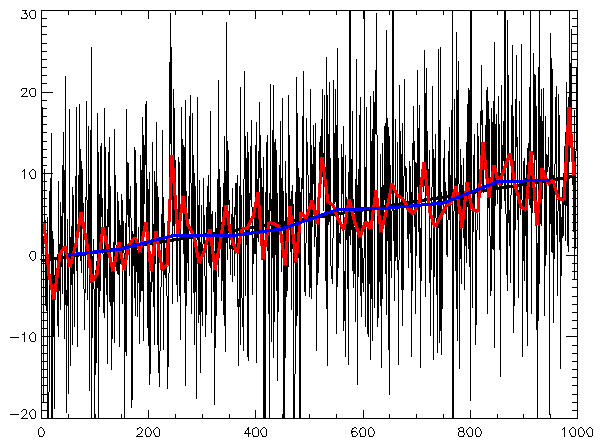
Describe key components for EDA on three years of daily user sign-ups
This tests time-series decomposition intuition. A strong answer covers trend, seasonality, and noise via plots, autocorrelation, and calendar effects, plus checks for missing days and outliers. Red flag: jumping to forecast models before validating structure.
How would you analyze a time series of user sign-ups?
This tests your structured approach to decomposing time series data. A strong answer identifies trend (long-term growth), seasonality (weekly/yearly patterns), and irregular components like spikes or dips.
Describe EDA for a 3-year daily user sign-up dataset.
Tests your structured approach to time series EDA. A good answer identifies trend, seasonality, and anomalies before modeling. A red flag is jumping to forecasting models or only mentioning the overall average growth, ignoring cyclical patterns.

How do you measure forecast accuracy and compare MAE to RMSE?
This tests out-of-sample validation and how MAE and RMSE weight errors. A strong answer demands a train-test split, defines both, and notes RMSE punishes outliers more while MAE is more robust. A red flag is citing in-sample fit instead of held-out error.
How would you measure a sales forecast model's accuracy?
Tests if you can link statistical metrics to business outcomes. Define MAE (average error) and RMSE (penalizes large errors). Choose RMSE when large misses are costly (e.g., stock-outs), MAE otherwise. A red flag is reciting formulas without business context.
How would you measure a sales forecast model's accuracy?
This tests your ability to connect statistical metrics to business impact. A great answer defines MAE (linear error cost) and RMSE (penalizes large errors), explains the choice depends on business context, and stresses using a test set.
What event and data payload track Add to Cart actions?
This tests GA4 ecommerce schema design. Fire add_to_cart with items array containing item_id, price, currency, quantity; include user_id, user_segment, session_id, and timestamp. Red flag: generic button_click with DOM selectors instead of semantic data.
Describe the client-side event for an 'Add to Cart' button
Tests your knowledge of standard analytics schemas (like GA4) and designing payloads for business analysis. A great answer names the 'add_to_cart' event, details the 'items' array with product data, and mentions user/session context.
Describe the client-side event for an 'Add to Cart' button
This tests your ability to design analytics events for future analysis. Name a standard event like add_to_cart and list item parameters (item_id, price, quantity).
How would you design UTM capture and attribution persistence?
Capture UTMs on landing, store in a first-party cookie with TTL, attach to events, and persist on conversion.
How would you capture UTM parameters for attribution?
This tests your grasp of the data lifecycle from capture to persistence. A good answer covers client-side parsing, cookie storage, and linking anonymous data to a user record upon sign-up. A red flag is forgetting to persist the data server-side.
How would you capture and persist UTM parameters for attribution?
Tests your grasp of state management and data persistence for analytics. A good answer covers capturing UTMs with JS, persisting them in a cookie, and associating them with a user record on the server during a conversion event.

Describe tracking a user event end-to-end from frontend to BI tool
Mention frontend instrumentation, routing, ingestion, warehouse transforms, and BI querying.
Describe tracking a user event from frontend to BI tool
Tests your grasp of the modern data stack. A great answer outlines the five stages: frontend emission, ingestion, loading into a warehouse, transformation, and BI visualization. A red flag is describing only the frontend code and ignoring the data pipeline.
Track a user event from frontend code to a BI tool
Tests your understanding of the modern data stack. A good answer traces the event from frontend capture, through an ingestion pipeline, into a data warehouse, and finally to a BI tool for analysis. A red flag is describing only one part of the journey.
We are hiring for this. Every open role lists the topics its interview covers, so you can prepare for the real thing rather than guessing.
See open roles