Advanced everything in Analytics & Metrics, page 5

Guarantee at-least-once delivery for a critical event?
This tests your grasp of atomicity without 2PC. A great answer outlines the Transactional Outbox pattern: write the event to a DB table in the same transaction as the business logic, then use a relay process. A red flag is relying on simple try/catch blocks.

Design a client-side event batching system for a high-traffic app
This tests your grasp of frontend performance and data reliability. Outline a batching strategy (timer/size), then explain using visibilitychange with navigator.sendBeacon() to prevent data loss on unload. A red flag is suggesting synchronous XHR.

How would you measure the ROI of a data analytics platform?
This tests your ability to connect platform engineering to business value. A great answer quantifies ROI via cost savings, revenue generation, and risk reduction, then details the systems (e.g., cost tagging, metadata tracking) needed.
How would you design an analytics strategy for a marketplace?
Tests your ability to balance conflicting needs in a complex system. A great answer covers core health (liquidity, match rate), side-specific KPIs (buyer satisfaction, seller utilization), and unit economics (take rate).
Data Ethics: Beyond 'Can We?' to 'Should We?'
Data ethics is the moral framework for handling data, especially personal data. It applies when building systems that collect user info or make automated decisions.
The Chief Data Officer: Turning Data into a Business Asset
The CDO is an executive who treats company data like a financial asset, not just a technical resource. They drive strategy in data-heavy firms, overseeing governance and analysis to create value.

User Journey Orchestration: From Map to Reality
User Journey Orchestration is the conductor for your customer's experience, ensuring every team and channel plays in harmony. It translates a static journey map into a live, consistent experience by coordinating actions across touchpoints.
Customer Resurrection Rate: Winning Back Lost Customers
Customer Resurrection Rate measures how many "lost" customers you win back. It's crucial for subscription or e-commerce businesses running re-engagement campaigns. The footgun is a vague definition of "churned"—without a clear line, the metric is meaningless.
Databricks: The Unified Platform for Data and AI
Databricks unifies your data warehouse and data lake into a single 'Lakehouse' platform. It's used for building ETL pipelines, training ML models, and running BI queries on the same data. The main footgun is cost: its power can lead to surprise bills.
Apache Spark: A Unified Engine for Big Data
Think of Apache Spark as a general-purpose engine for large-scale data analytics. It lets you program an entire cluster of machines as one, automatically handling data parallelism and fault tolerance so you can focus on the analysis itself.
Snowplow: A Private Pipeline for Event Data
Think of Snowplow not as an analytics tool, but as a private pipeline you own for creating high-quality event data. It collects raw events, validates them against schemas, and loads them into your warehouse. The footgun is expecting turnkey dashboards.
Apache Kafka: A Distributed Log for Data Streams
Think of Kafka as a durable, append-only log for events, not just a temporary message queue. It excels at handling high-throughput, real-time data feeds for analytics or log aggregation. The footgun is treating it like a simple broker, leading to data loss.
Workforce Analytics: Data-Driven People Decisions
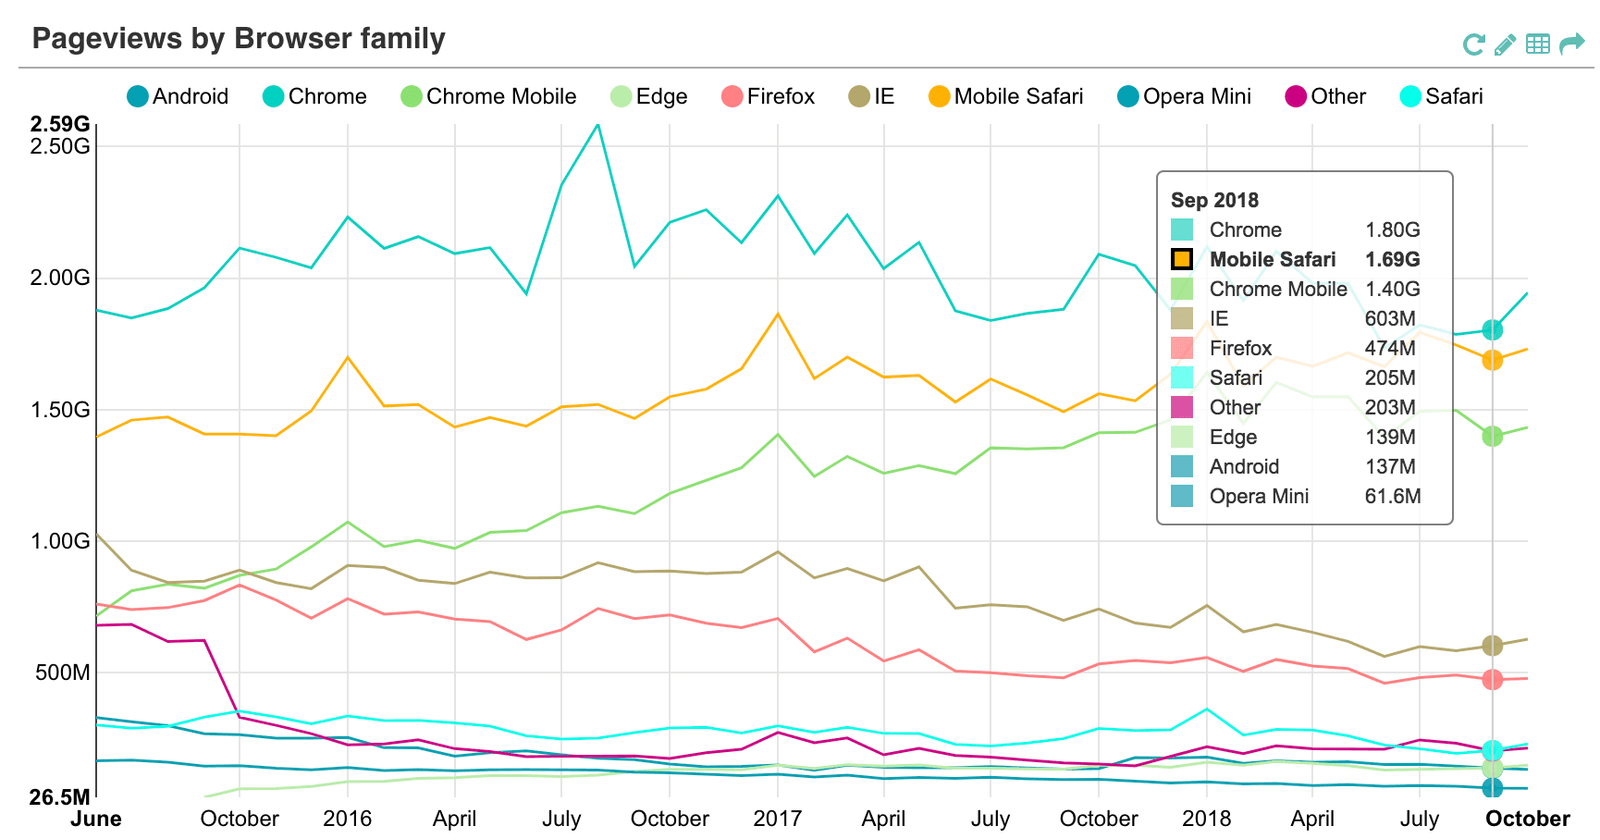
Workforce Analytics applies systematic data analysis to people-related decisions, moving beyond gut feelings for hiring and promotions. It's used to predict turnover or measure training ROI.
Business Analytics vs. Business Intelligence
Business Analytics predicts the future and prescribes actions, while Business Intelligence describes the past. BI reports last month's sales; BA forecasts next month's demand.
Marketing Mix Modeling (MMM): Isolating Marketing's Impact on Sales
Marketing Mix Modeling (MMM) statistically links aggregate marketing efforts to sales outcomes over time. It's used to determine the ROI of past campaigns, like a TV ad blitz. The main footgun: the model is only as good as the historical data you feed it.
Ensemble Forecasting: Predicting with a Crowd of Models
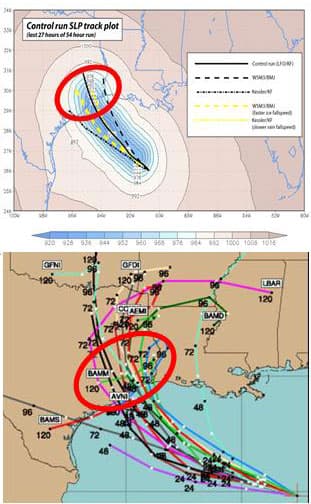
Instead of one 'best guess,' ensemble methods generate many forecasts to map the range of possibilities. This is crucial for complex systems like weather prediction, where a single model is misleadingly precise.

LSTMs: Giving Neural Networks a Long-Term Memory
LSTMs give neural networks a selective memory, letting them remember important information over long sequences. This is key for language translation or time-series forecasting where old context matters.

Granger Causality: Forecasting, Not Causing
Granger Causality tests if one time series can forecast another, not if it causes it. It's used in econometrics to see if money supply changes predict inflation. The footgun is the name itself: it only shows predictive power, not true cause-and-effect.
ARIMA: Forecasting by Modeling Autocorrelation
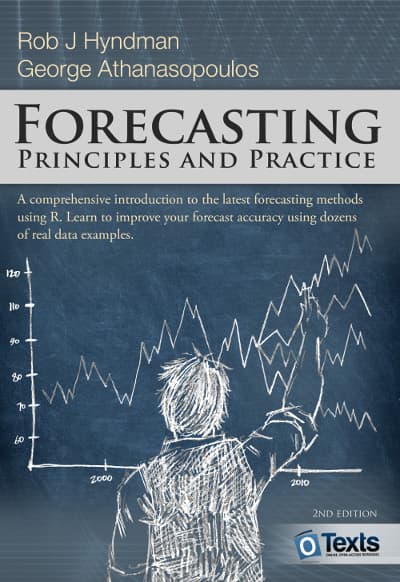
ARIMA models forecast a time series by learning its "memory"—how past values influence the next. It's used for forecasting sales or server load where patterns are driven by internal dynamics.
Propensity Score Matching: Mimicking an A/B Test
Propensity Score Matching (PSM) mimics a randomized trial with observational data by finding a "statistical twin" for each subject. It's used to estimate a feature's impact when a true A/B test isn't possible. The footgun is assuming it removes all bias.
We are hiring for this. Every open role lists the topics its interview covers, so you can prepare for the real thing rather than guessing.
See open roles