Easy everything in Analytics & Metrics, page 4
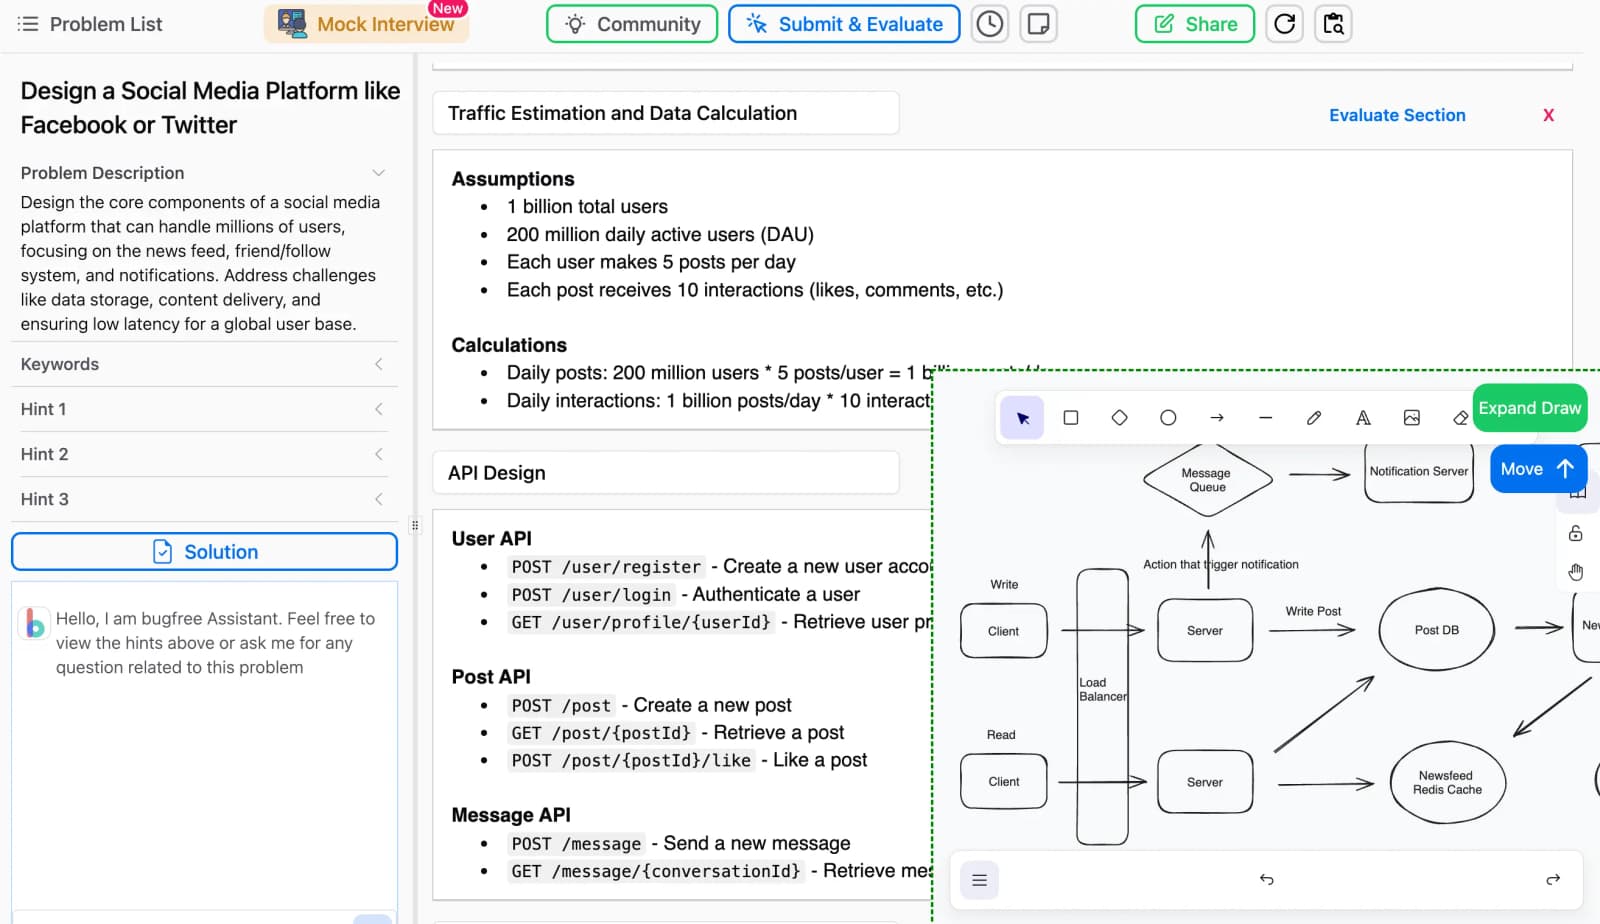
DAU dropped 10%. What user segments do you investigate first?
Tests your systematic problem-solving. First, clarify the metric and timeline. Then, segment by platform, geography, and user tenure (new vs. returning). A red flag is jumping to external causes before ruling out internal issues like a bad deployment.
Bar Chart vs. Line Chart for Market Share Comparison?
Tests basic chart selection: comparing static categories vs. showing trends. A bar chart is correct for comparing discrete companies at one point in time. A line chart wrongly implies a time-series relationship. Red flag: choosing a line or pie chart.

When is a pie chart an appropriate choice for visualization?
Tests data viz principles for part-to-whole data. A good answer defines this use case, gives a clear example (market share), and lists pitfalls like too many slices or similar values. A red flag is defending them for complex data or time-series analysis.
Why use p50/p95 over mean for API response times?
Tests your grasp of statistical distributions for UX metrics. A good answer explains how outliers skew the mean, while percentiles (p50, p95) better represent typical and worst-case user experiences.

What is a data schema and why enforce it on ingestion?
This tests your grasp of data governance. Define a schema as a data blueprint. Explain that enforcement on ingestion prevents "garbage in, garbage out" by validating types and formats, ensuring data is usable for analytics.
How would you validate user-submitted email addresses at ingestion?
Tests your understanding of data validation beyond simple regex, focusing on robustness and system-level thinking. A good answer covers format checks, DNS/MX record validation, and blocking disposable services.
How would you handle 10% nulls in a key column?
This tests your ability to diagnose data issues before solving. First, investigate why data is null. Then, discuss trade-offs of dropping vs. imputing with the mean or median, considering the impact on the dashboard's accuracy.

What is a data warehouse vs. a transactional database?
Tests your grasp of read-optimized (OLAP) vs. write-optimized (OLTP) systems. A great answer defines warehouses for analysis, contrasts them with transactional DBs for operations, and explains the resulting differences in workload, schema, and data structure.
Build a pipeline to load CSVs into a database
Tests your grasp of event-driven architecture and basic ETL. A good answer outlines a trigger (storage event), a processing function (serverless), and a destination (database), mentioning error handling. A red flag is describing a manual or cron-based process.

ETL vs. ELT: Key differences and when to use each?
This tests your understanding of modern data architecture trade-offs. A good answer explains the T vs. L order, then links ETL to structured, legacy systems and ELT to flexible, cloud-native data lakes/warehouses.

Translate 'increase engagement' into a technical measurement plan
This tests your ability to translate vague business goals into concrete metrics. First, clarify the goal with the PM. Then, propose specific, measurable proxy metrics (e.g., DAU/MAU, session length). Finally, outline the instrumentation plan.
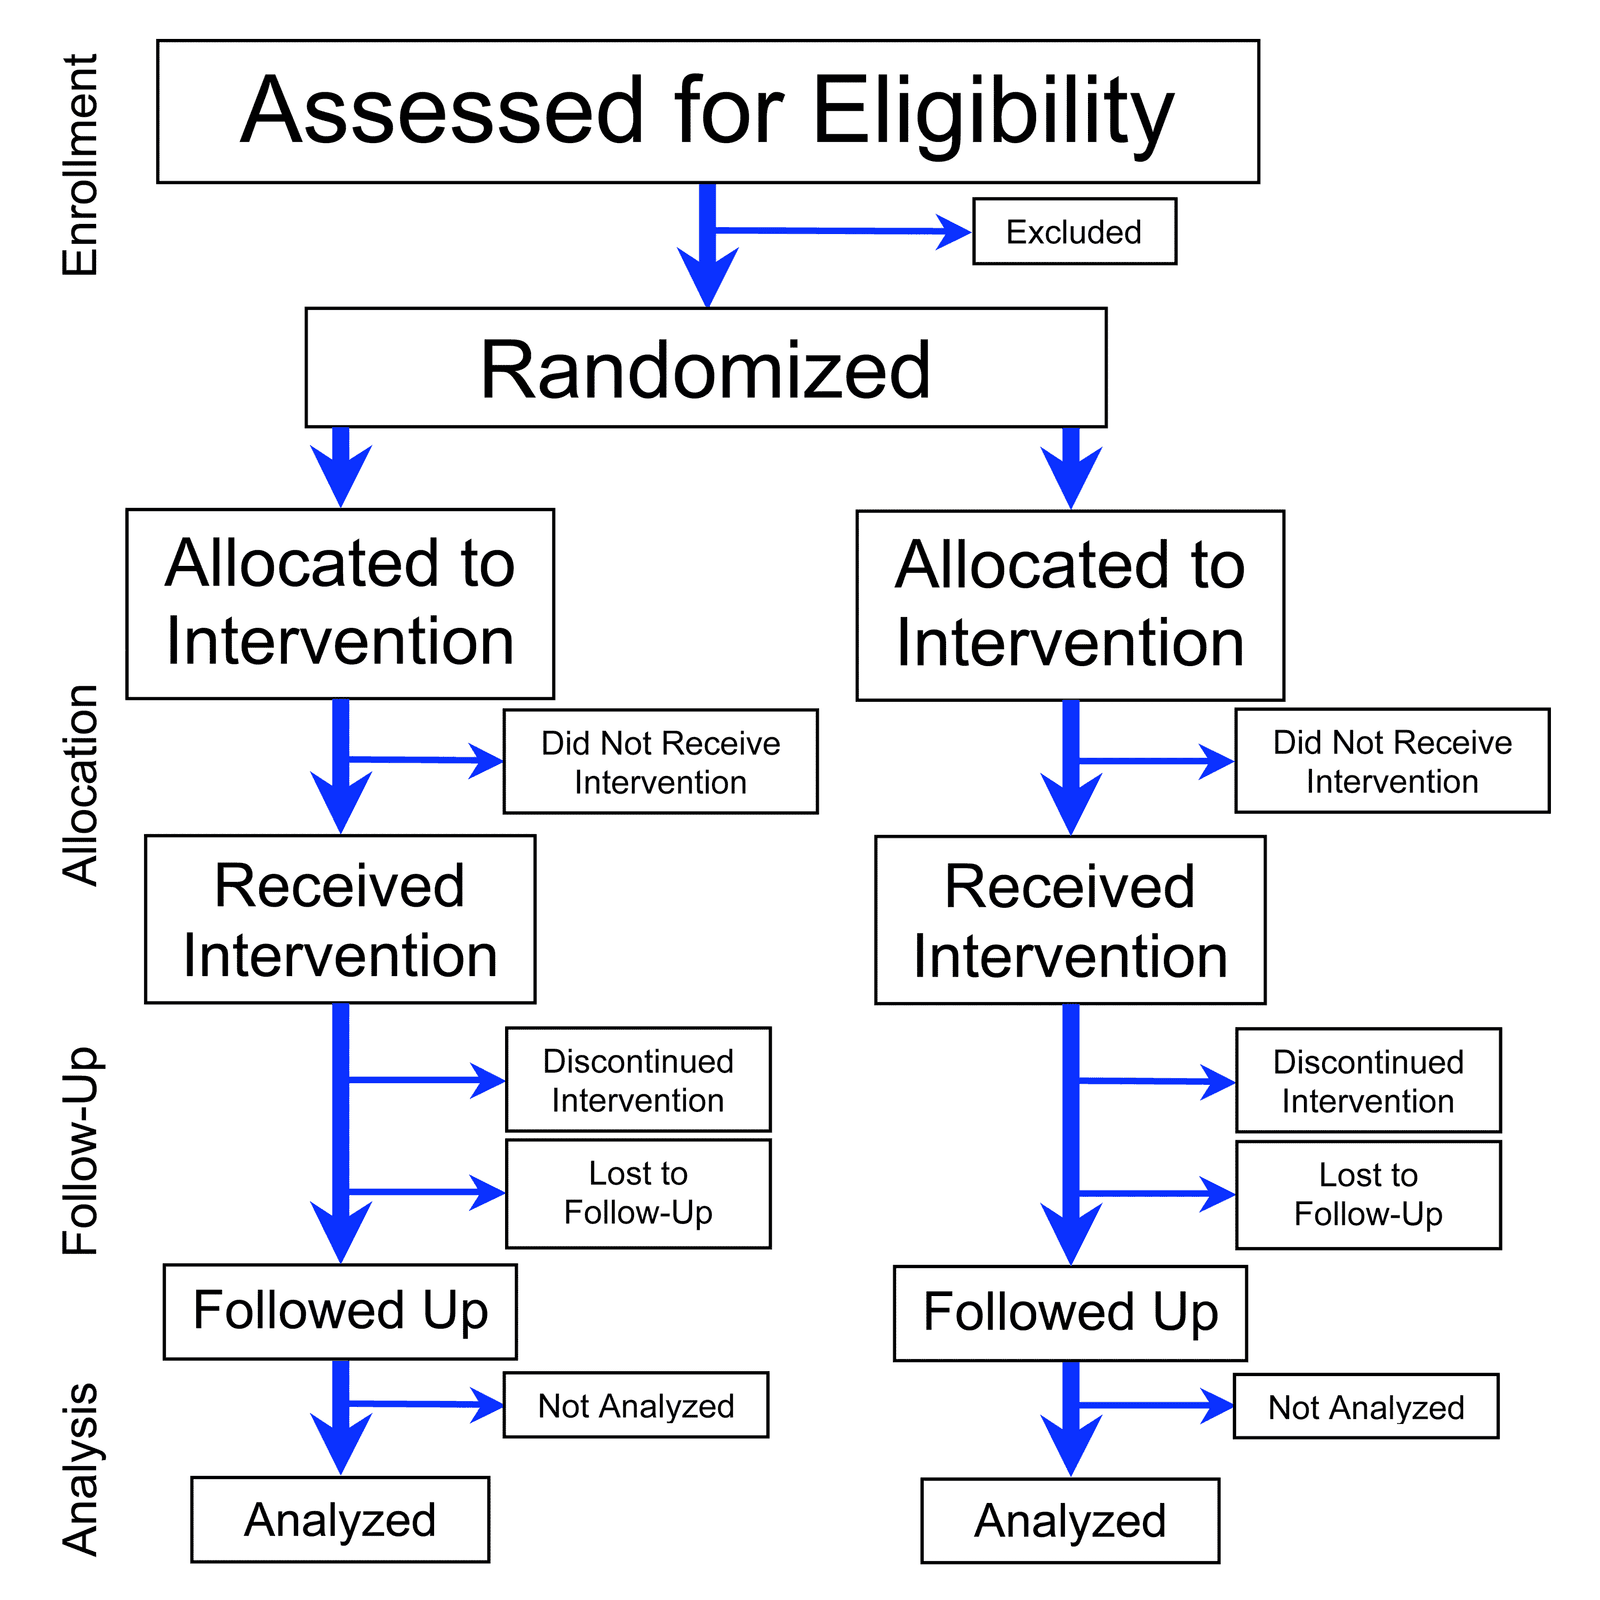
Randomized Controlled Trials: The Gold Standard for 'Did It Work?'
An RCT is a science fair experiment for business decisions, isolating one change to see its true effect. It's used in A/B tests to prove a new feature worked. The biggest footgun is peeking at results early, which can lead to false conclusions.

ETL: The Assembly Line for Your Data
ETL (Extract, Transform, Load) is an assembly line for data, moving it from various sources into a single destination for analysis. It's used to populate data warehouses by combining data from databases, logs, and APIs into a unified view.
Single Source of Truth (SSOT): One Place for Every Fact
A Single Source of Truth (SSOT) means every piece of data has one authoritative home. Instead of emailing report_v3.docx, you share one link. This prevents conflicts between billing and shipping data.

HiPPO: Highest Paid Person's Opinion
HiPPO stands for "Highest Paid Person's Opinion," where a senior leader's gut feeling overrules data. This occurs when deciding on features without A/B tests. The footgun: a HiPPO's intuition can kill great ideas or greenlight costly failures.
Data Literacy: Reading the Story in the Numbers
Data literacy is reading comprehension for numbers. It's the ability to turn raw data into a coherent story, a crucial skill for anyone using dashboards or A/B test results. The biggest footgun is confusing correlation with causation.

Training vs. Test Sets: Judging a Forecast's True Accuracy
Don't judge a forecast by how well it fits the data it was trained on. To measure true accuracy, split your data into a training set for model fitting and a test set for evaluation, using data the model has never seen before.
Tag Management Systems: Control Your Analytics Snippets
A Tag Management System (TMS) is a single container for all the analytics and marketing scripts you'd otherwise hardcode. Instead of asking engineers to add new scripts, you add them via a web UI.
Feature Adoption Rate: Measuring if New Features Deliver Value
Feature adoption rate measures if users actually use specific features, not just log in. It's vital for SaaS products to prove ongoing value for renewals. The footgun: a low rate means customers pay for unused bloat, which actively hurts perceived value and…

Activation Rate: Measuring the 'Aha!' Moment
Activation rate measures the percentage of users who experience your product's core value, not just sign up. It's a key metric for diagnosing onboarding effectiveness. The common mistake is tracking 'completed onboarding' instead of the 'aha!'
We are hiring for this. Every open role lists the topics its interview covers, so you can prepare for the real thing rather than guessing.
See open roles