Intermediate everything in Analytics & Metrics, page 10
Design a Data Quality Monitoring & Alerting System
This tests translating business needs into a concrete data validation strategy. A good answer defines checks based on business impact (freshness, volume, schema), then outlines a tiered alerting system. A red flag is naming tools before defining the problem.

Design a Centralized Metrics Layer
This tests your grasp of data governance and creating a single source of truth. A good answer defines a semantic layer between the data warehouse and BI tools, centralizing metric definitions in code.

Design a data warehouse model for tracking feature adoption
This tests your grasp of data warehousing star schemas for efficient behavioral analysis. A strong answer proposes a central events fact table linked to users, features, and time dimension tables.

Explain cohort analysis for user retention and write a pseudo-query
Tests your ability to use precise metrics. A good answer defines a cohort, explains why it isolates variables better than aggregate data, outlines the calculation, and provides a clear pseudo-query.
Explain event schemas and the purpose of a schema registry
This tests your grasp of data governance in event-driven systems. A good answer defines a schema as a contract, a registry as the enforcer, and then details specific downstream failures like broken pipelines and bad analytics. A red flag is being too vague.
How would you design a data model for a feature adoption dashboard?
Tests applying dimensional modeling to a business need. A good answer defines a central fact table (e.g., feature_usage) and related dimensions (user, feature, date). A red flag is designing a transactional model or being too vague about the schema.

Describe dbt's role in a modern analytics stack
Tests your grasp of the ELT paradigm and applying software engineering principles to data. A good answer defines dbt as the 'T' in ELT, contrasts its in-warehouse SQL approach with traditional ETL, and clarifies its relationship with orchestrators like…
How would you measure P95 latency by geographic region?
Tests your ability to design a practical metrics pipeline, considering instrumentation, data types (metrics vs. logs), and aggregation. Instrument the API with a histogram metric and a region label, then query using histogram_quantile.

Forecasting inventory with trend and weekly seasonality?
This tests mapping a business problem to a statistical tool. A good answer names Holt-Winters, explains its level, trend, and seasonal components, and discusses additive vs. multiplicative seasonality.
Train-test split vs. time-series cross-validation?
Tests if you see why temporal data breaks random splits. Contrast random sampling with sequential 'walk-forward' validation, where you only use past data to predict the future.
Explain stationarity in a time series
This tests your grasp of core time series modeling assumptions. A strong answer defines stationarity (constant mean/variance), explains its importance for ARIMA (stable patterns), and names a test (ADF) and a fix (differencing).

Primary vs. Guardrail Metrics in Experiments
This tests if you can balance improving a key metric with not harming the user experience. Define primary (the goal) and guardrail (don't harm) metrics. Give an example where a guardrail regression (e.g., latency) blocks a feature ship.
Handling the novelty effect in experimentation
This tests your grasp of second-order effects in A/B testing. A great answer defines the novelty effect, explains how it inflates initial metrics, and suggests mitigating it by running tests longer or segmenting by user tenure. A red flag is ignoring it.

Why is stopping an A/B test when it hits significance problematic?
Tests your understanding of the 'peeking problem' in A/B testing. A great answer defines peeking, explains how it inflates the Type I error rate (false positives), and states the need for a predetermined sample size.
How do you determine A/B test sample size and duration?
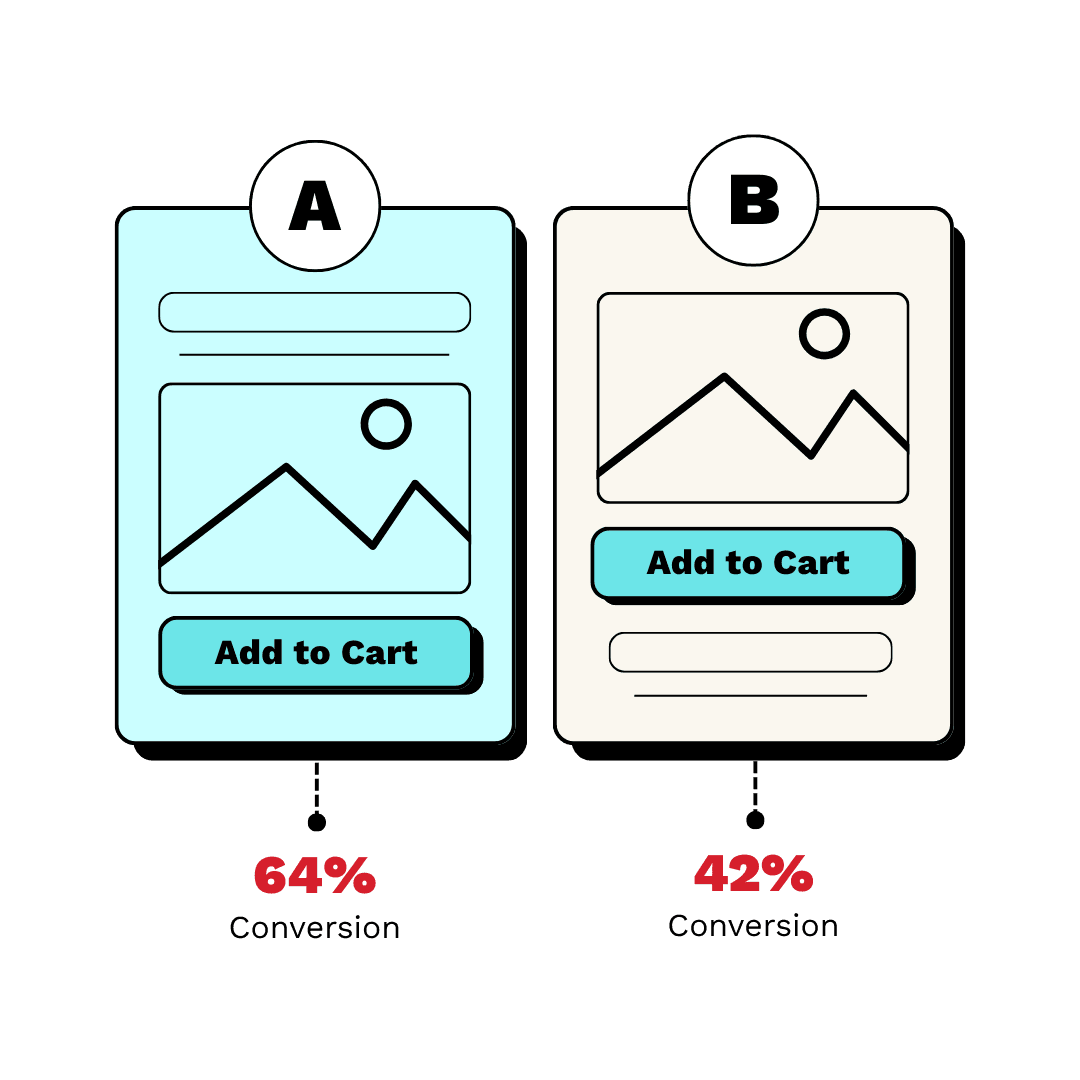
This tests your ability to connect business goals to statistical parameters. A good answer defines the four power analysis inputs (baseline, MDE, alpha, power) and explains trade-offs, then converts sample size to duration using business cycles.

Explain Simpson's Paradox with a user engagement example
This tests your understanding of statistical pitfalls in A/B testing. A good answer defines the paradox, gives an example where a feature fails in aggregate but wins in every segment, and attributes it to a confounding variable.
How to Statistically Test a 10% DAU Drop?
Tests your knowledge of hypothesis testing. A good answer outlines the steps: state a null hypothesis, choose a test (e.g., Z-test), calculate a p-value, and compare it to a significance level (alpha).
Explain the difference between correlation and causation
Tests if you can avoid statistical fallacies. First, define correlation (association) and causation (cause-effect). Then, explain the difference via a confounding variable. A red flag is giving an example where one metric actually could cause the other.
p-value is 0.08, significance is 0.05. Ship it?
This tests your ability to translate statistical risk for business partners. Explain that p=0.08 means an 8% chance of a false positive, quantify the cost of a bad decision, and suggest extending the test to increase power.
An A/B test has imbalanced traffic. What do you do?
This tests your ability to spot confounding variables and Simpson's Paradox. A good answer first invalidates the aggregate result, then proposes segmenting by device to salvage insights, and finally investigates the root cause.
We are hiring for this. Every open role lists the topics its interview covers, so you can prepare for the real thing rather than guessing.
See open roles