Intermediate everything in Analytics & Metrics, page 7

A/B Test Results with Skewed Traffic: What's Next?
This tests your ability to spot confounding variables. A good answer invalidates the results due to sampling bias, proposes segmenting the data by device to find the true effect, and suggests re-running the test with correct randomization.

How to query a monthly cohort retention table in SQL?
Tests your ability to translate a core business metric into a multi-step SQL query. A good answer finds each user's acquisition month, joins that back to their activity, and pivots the data into a cohort grid. A red flag is calculating aggregate retention.

Average latency is up 50ms, but p99 is flat. How do you diagnose this?
Tests your grasp of latency metrics. A rising average with flat p99 means the *bulk* of requests (p50-p90) slowed, not the tail. Hypothesize a common bottleneck and segment data by endpoint/user to find it. Red flag: blaming new, slow outliers.

Explain pre-attentive attributes in data visualization
Tests designing high-signal UIs. Define pre-attentive attributes as visual cues processed instantly (e.g., color, size, shape). Apply one to make key data 'pop' in a dense chart.
Stakeholder claims correlation implies causation. How do you investigate?
This tests your scientific rigor beyond the simple "correlation isn't causation" mantra. Acknowledge the finding, probe for confounding variables, suggest cohort analysis, and propose an A/B test. A red flag is reciting the mantra without a concrete plan.

How would you design a product management dashboard?
This tests your ability to structure data hierarchically for a specific persona (PM). A great answer outlines a 3-tier structure: summary KPIs, trend analysis, and drill-downs. A red flag is listing charts without explaining how they guide PM decisions.

How do you handle duplicate events in an analytics pipeline?
Tests your grasp of data integrity and idempotent processing. Explain how duplicates inflate COUNT(*), then propose adding a unique event_id and using a stateful stream processor to track seen IDs. Mention query-time COUNT(DISTINCT event_id) as an alternative.
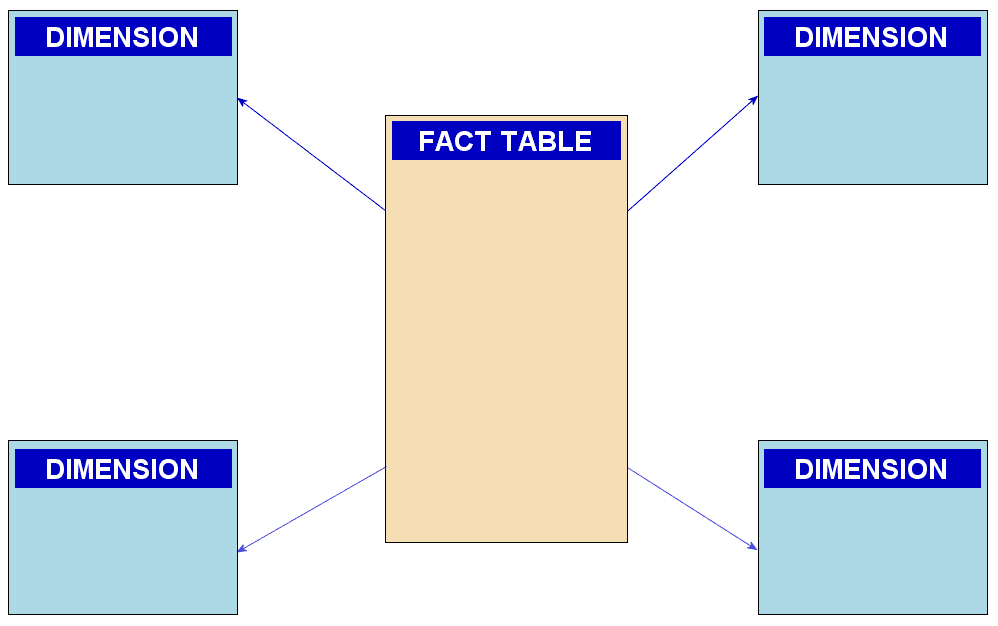
Explain the star schema and its advantages for analytics
This tests your grasp of OLAP vs. OLTP data modeling. A great answer defines fact/dimension tables, explains how denormalization leads to fewer joins and faster queries, and contrasts this with 3NF's focus on write integrity.
How to diagnose a slow dashboard query?
This tests systematic debugging of a data problem. A good answer investigates the query plan first, then the table's physical layout (partitioning/clustering), and finally the BI tool and warehouse load. A red flag is jumping to a solution without diagnosis.
How do you create a 'golden record' from fragmented data?
Tests your ability to design a data reconciliation system. A great answer outlines a process: profiling sources, defining survivorship rules, implementing a matching engine, and creating a stewardship process. A red flag is suggesting a simple one-off script.

Handle Schema Evolution in a CDC Analytics Pipeline
This tests your ability to design robust data systems that anticipate change. A great answer includes a schema registry, compatibility rules, a dead-letter queue for non-compliant records, and automated alerting.
Explain data lineage and how you would implement it
This tests your ability to design for data observability. Define lineage (origin, transformation, movement), then propose a solution using metadata extraction (OpenLineage) and a central graph store/UI (Marquez) to trace data from microservices to analytics.
Data Warehouse vs. Data Lake vs. Lakehouse
Tests your grasp of modern data architectures. A great answer defines warehouses (structured, schema-on-write) and lakes (raw, schema-on-read), then explains how a lakehouse adds ACID transactions and governance on top of a lake.
What is data partitioning in a cloud data warehouse?
Tests your grasp of physical data layout optimization. A good answer defines partitioning as dividing a table by a column (e.g., date), then explains how this enables partition pruning to improve query speed and reduce cost by scanning less data.
Handling Late-Arriving Data in a Streaming Pipeline
Tests your grasp of event time vs. processing time. A great answer defines watermarks to track completeness, uses event-time windowing to group data, and sets triggers with allowed lateness to correctly incorporate out-of-order events.
Star vs. Snowflake Schemas: Trade-offs
Tests your grasp of data warehouse design trade-offs. Define star (denormalized, fast queries) and snowflake (normalized, storage efficient) schemas. Explain the core trade-off: star's query speed vs. snowflake's storage/integrity.
How do you approach user identity stitching?
This tests your grasp of data architecture for analytics, not just a simple algorithm. A strong answer defines anonymous vs. known IDs, explains the backfilling/rekeying process upon authentication, and notes the need for a central event store.

Build vs. Buy: Third-Party Analytics SDK or In-House Pipeline?
This tests your grasp of the time vs. control trade-off. A great answer weighs the speed of buying against the total control of building, focusing on the hidden, long-term maintenance costs of an in-house solution.
Sudden metric drop, no recent deployments. What's the cause?
This tests your ability to debug data discrepancies beyond code, focusing on the analytics pipeline. First, distinguish data loss from misattribution. Then, check processing delays and hidden data sources. A red flag is not segmenting data first.

How do you track page views in a Single Page Application?
Tests your grasp of SPA navigation vs. traditional page loads. A great answer explains how SPA routers use the History API (pushState) and how to listen for changes to send analytics events. A red flag is suggesting polling the URL.
We are hiring for this. Every open role lists the topics its interview covers, so you can prepare for the real thing rather than guessing.
See open roles