Everything in Data Science & Analytics, page 7
Convert string timestamps to datetime and extract day of week
This tests pandas datetime parsing and accessor fluency. A strong answer uses pd.to_datetime, assigns the result, then extracts the day via .dt.day_name() or .dt.dayofweek. Red flag: manual string splitting or Python loops instead of vectorized ops.
Calculate total and average sales per region in pandas
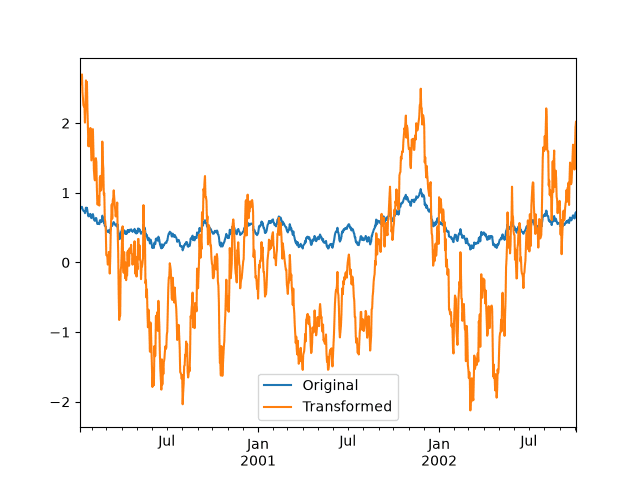
Tests split-apply-combine fluency. A strong answer groups by Region then calls agg with a dict or named aggregation to return sum and mean of Sales_Amount together. Red flag: chaining separate groupby calls or looping rows manually.
What is vectorization in NumPy and pandas?
Tests if you know why NumPy operations beat Python loops via contiguous memory and C-level SIMD. A strong answer defines vectorization as array-wide operations without explicit loops, contrasts a ufunc to a for-loop, and cites interpreter overhead removal.
How would you combine customer and transaction DataFrames and describe join types?
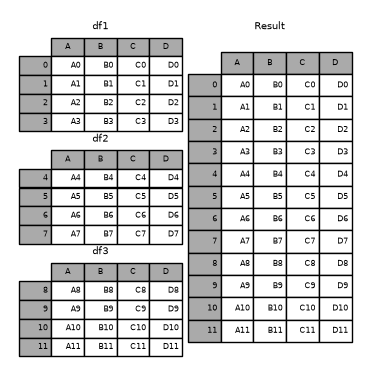
This tests relational merging and join semantics in pandas. Answer: use pd.merge on customer_id, then groupby sum; describe inner, left, right, and outer joins by key preservation. Red flag: proposing concat without keys or conflating inner and left joins.
Most efficient way to convert list of dicts to pandas DataFrame
Tests knowledge of DataFrame construction versus repeated row-wise assembly. Answer: pass the list directly to pd.DataFrame(data); it aligns missing keys as NaN. Red flag: recommending iterative DataFrame building.
Describe strategies for handling missing values in pandas DataFrames
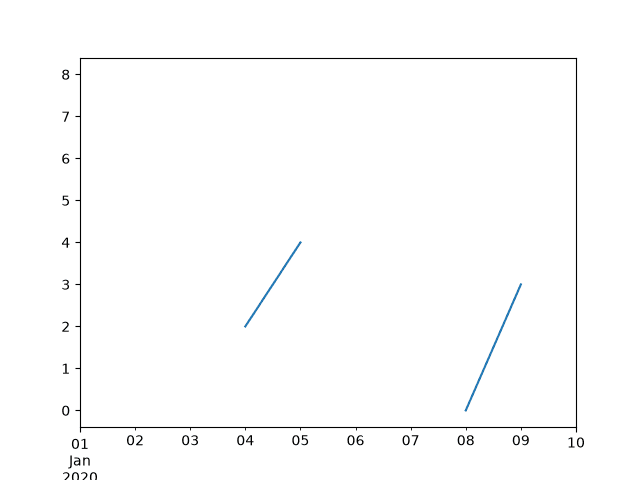
Tests practical judgment on cleaning trade-offs. Good answers contrast dropna when data is abundant against fillna imputation to preserve rows, noting bias risk. Red flag: prescribing one fix without asking why values are missing or what the model needs.
How do you determine sample size for a conversion lift experiment?
Tests fluency with statistical experiment design. A strong answer frames N as a function of alpha, power, baseline rate, and MDE, noting that shrinking the MDE or raising power inflates N. Red flag: picking N from traffic instead of risk tolerance.

Why is 99% accuracy misleading with 1% disease prevalence?
Tests class imbalance intuition. A strong answer notes that an all-negative classifier hits 99% accuracy, then names precision, recall, F1, and AUC-PR to expose false negatives and false positives. Red flag: claiming accuracy is fine after rebalancing.

Describe the bias-variance tradeoff and how model complexity affects bias and variance
More complexity cuts bias but boosts variance via overfitting; test error forms a U.
Explain the Central Limit Theorem and its importance for hypothesis testing
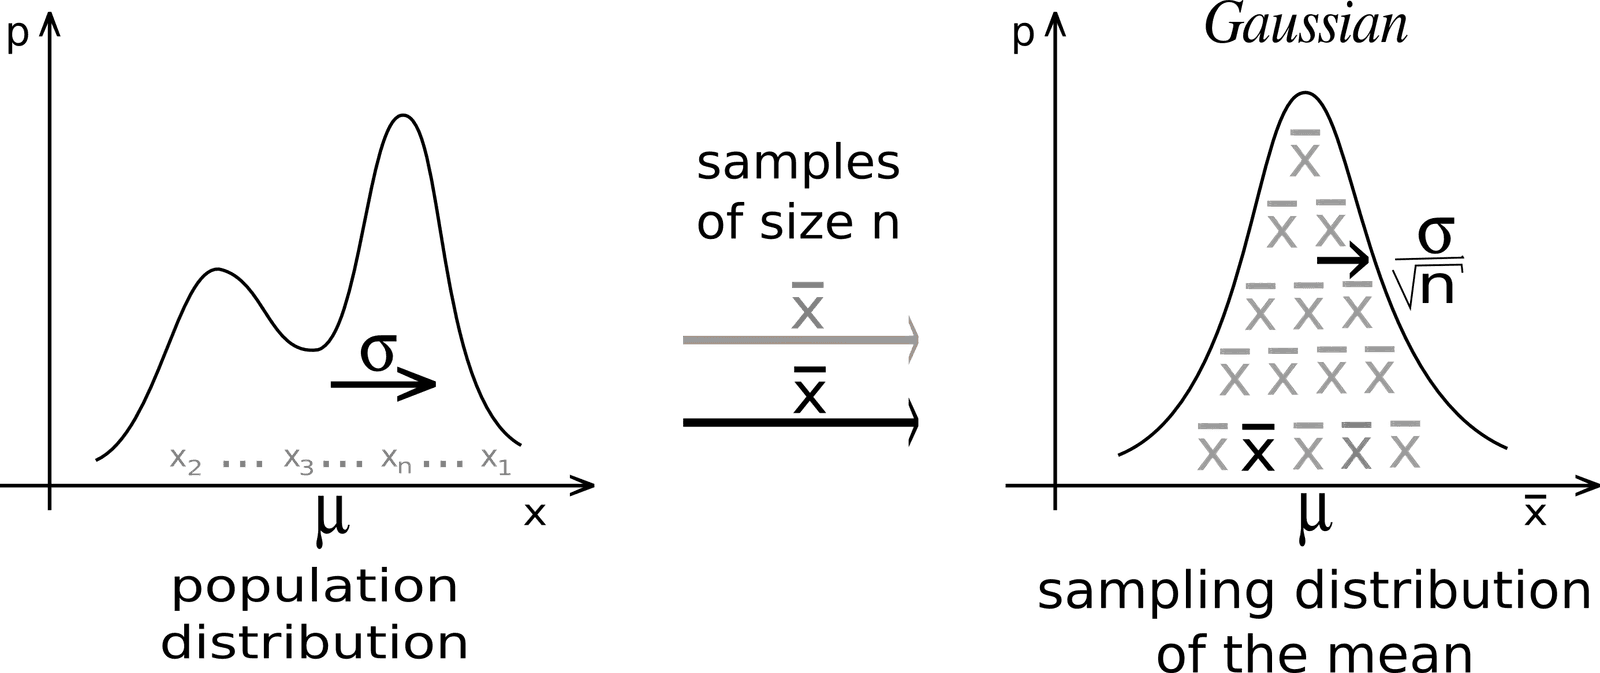
This tests whether you know why sample means from skewed populations tend toward normal as size grows, enabling tests. A strong answer covers mean convergence to normal and standard error. Red flag: claiming the CLT works for small samples or single points.
What is a p-value? Interpret p = 0.03 at alpha = 0.05.
Tests frequentist testing and p-value misinterpretations. Define p-value as the probability of data this extreme under the null; since 0.03 < 0.05, reject the null at 5%. Never say it is the probability the null is false or the result is due to chance.

What are your null and alternative hypotheses for this A/B test?
This tests translating a directional business question into statistical hypotheses. A strong answer states H0 as no improvement (or a point-null equality for a specified test) and H1 as green outperforming blue. A red flag is framing H0 as 'blue is better' or changing the tail after seeing data.

How would you build and validate a proxy target for employee burnout?
Combine survey scales with behavioral signals such as off-hours logins and PTO drops; validate via convergent and predictive validity against attrition.

How do you frame high-value customer identification as classification versus regression?
Tests mapping a business goal to a defensible target. Outline: define value and action, then contrast regression predicting spend versus classification predicting tiers. Red flag: picking models before fixing the label or the campaign action.
How would you recommend launching a checkout flow with mixed A/B metrics?
This tests multi-metric trade-offs. A strong answer tags conversion as success and AOV as a guardrail, estimates net revenue impact, and frames decision as a risk-managed business choice. A red flag is demanding all metrics win or ignoring business context.
How do you define churn for a subscription service?
This tests operationalizing a business metric into a data definition. A strong answer separates voluntary from passive churn, picks a moment, and aligns to the billing cycle. Red flag: counting all cancellations as churn while ignoring grace periods.

How would you validate that search users are more likely to purchase?
This tests correlation versus causation in product analytics. A strong answer defines the purchase window, matches searchers to similar non-searchers, and picks a statistical test. A red flag is running a t-test without controlling for user intent or time.
What metrics track e-commerce user engagement and how do you prioritize them?
Track product discovery, add-to-cart, checkout, purchase, repeat purchase, and engagement signals; prioritize by conversion, revenue, retention, and customer value.
ML Model Registry: Source of Truth for Production Models
A model registry is version control for trained models, not just code. It tracks which artifact is running in production, who approved it, and how it was built. Skip it and you get untracked files in S3 with no way to reproduce a production model.
Spark Structured Streaming: Unify Batch and Stream
Spark Structured Streaming treats a live stream as an unbounded DataFrame. It unifies batch and streaming ETL on Kafka, but the footgun is confusing event time with processing time without watermarks, which silently drops late data.
We are hiring for this. Every open role lists the topics its interview covers, so you can prepare for the real thing rather than guessing.
See open roles