Everything in Data Science & Analytics, page 9
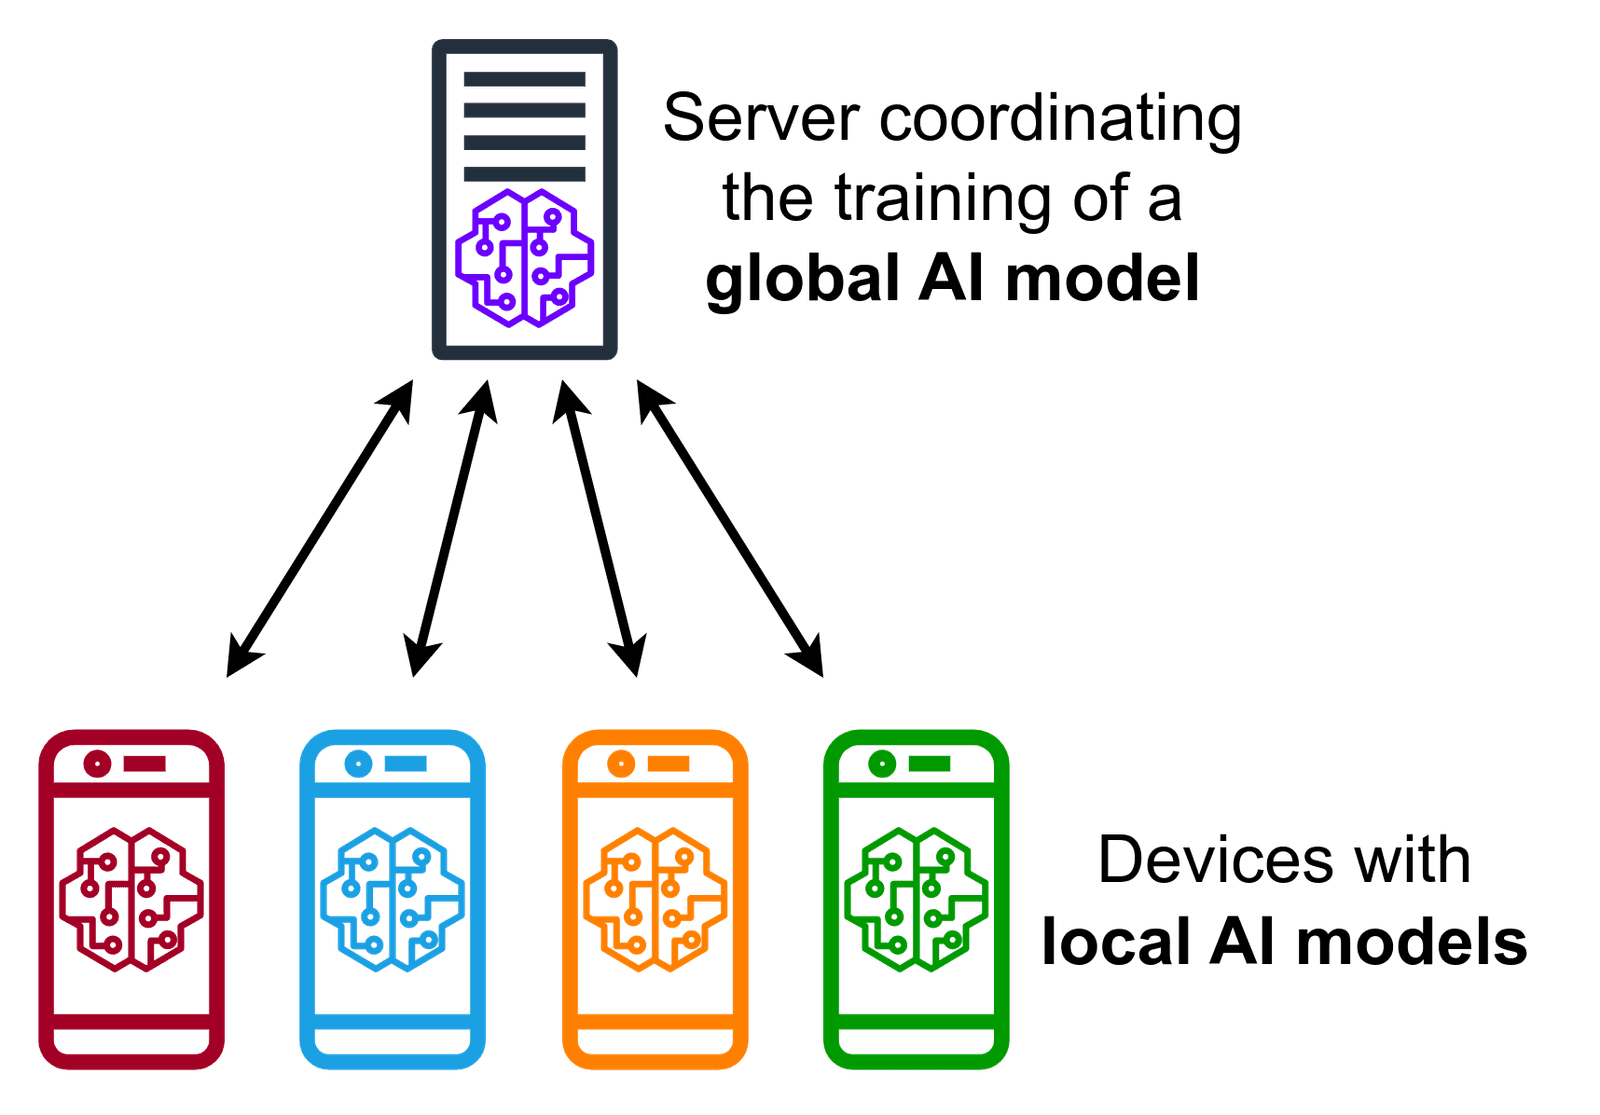
Federated Learning: Train Models on Decentralized Data
Federated learning trains a shared model by sending the model to the data, not the other way around. It's used for training on sensitive, decentralized data like phone keyboards. The main footgun is that non-uniform data across clients can skew the model.
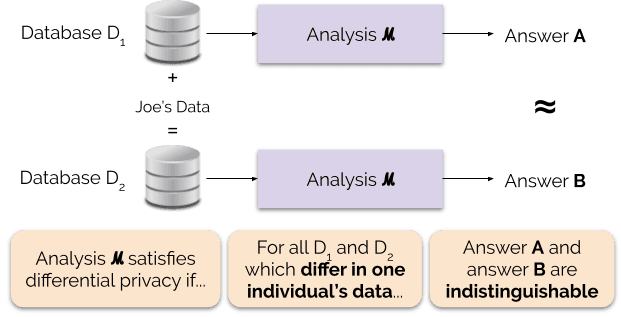
Differential Privacy: Anonymize Data with Math
Differential Privacy adds mathematical noise to data queries, making it impossible to know if one person's data is included. Tech giants use it to learn from user behavior without seeing individual activity.
AI Safety: Preventing Unintended Consequences
AI Safety is the engineering discipline for preventing intelligent systems from causing harm, by accident or misuse. It's crucial for autonomous systems like self-driving cars or large models that can amplify bias.
Datasheets for Datasets: The Nutrition Label for Data
A datasheet is like a nutrition label for a dataset, documenting its origins, contents, and intended use. This is crucial for high-stakes ML systems where hidden biases could cause harm.
Fairness Metrics: Auditing Your AI for Bias
Fairness metrics are statistical checks to see if your model's decisions are biased against certain groups. They're crucial for automated systems in hiring or loan approvals.

AI Accountability: Who's Responsible When AI Fails?
AI accountability means someone is answerable for an AI's actions. It requires organizations to manage risks and trace decisions throughout the AI's lifecycle, ensuring systems function properly and align with human-centric values.
AI Transparency: Explaining the Black Box's 'Why'
AI transparency means seeing the 'why' behind an algorithm's decision, not just its code. It's vital for high-stakes systems like credit scoring or news feeds. The footgun is thinking open-sourcing the model is enough; true transparency explains the logic.
Disparate Impact: When Fair Rules Aren't Fair
Disparate impact is when a neutral rule causes a discriminatory outcome, regardless of intent. This is key in ML fairness, where an algorithm might deny loans to one group more than another, even with objective rules.
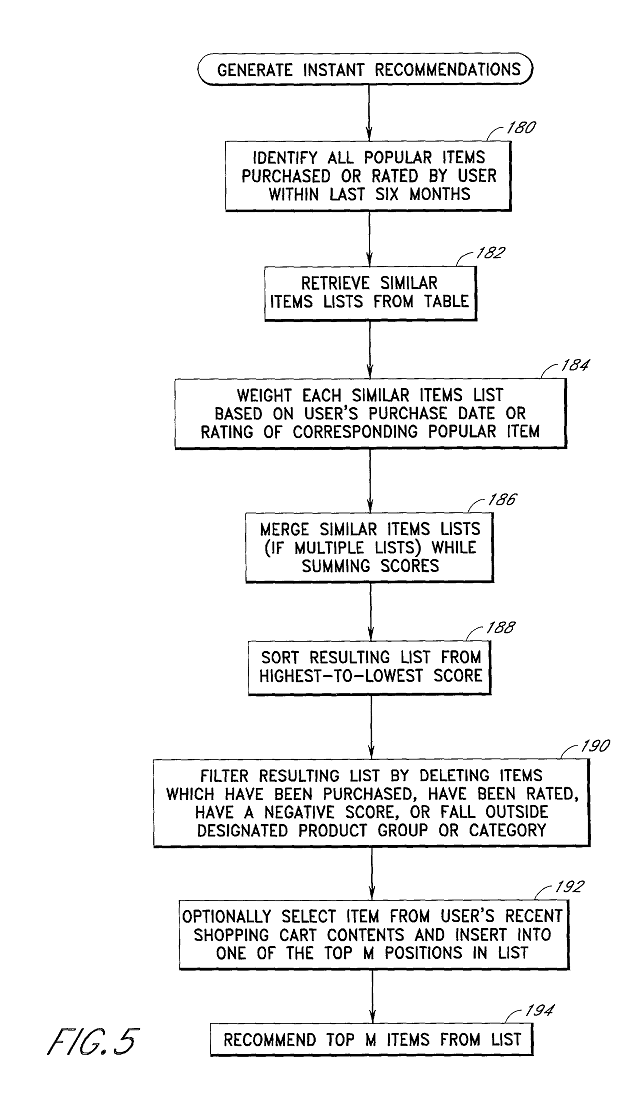
Algorithmic Bias: When Code Creates Unfair Outcomes
Algorithmic bias is a mirror reflecting flawed human data, leading to systematically unfair outcomes. It appears in hiring tools favoring one gender or loan systems denying certain groups. The footgun is assuming tech is neutral; the bias is in the data.
IaC for MLOps: Your ML Factory's Blueprint
Treat ML infrastructure—training clusters, model registries, serving endpoints—as code in version-controlled files. This ensures reproducible experiments and consistent deployments across environments.
Data Drift: Why Good Models Go Bad
Data drift is when a model's accuracy decays because the real-world data it was trained on has changed. This happens in fraud detection as scams evolve or in e-commerce as trends shift.

Model Monitoring: A Health Check for Production AI
Model monitoring is a smoke detector for your AI, alerting you when its performance degrades. It compares live data to training data to catch data drift or shifts in user behavior. The footgun is assuming a model, once deployed, performs well forever.

Model Cards: The Nutrition Label for AI
A Model Card is a nutrition label for an ML model, detailing its performance, biases, and intended use. It's vital for high-stakes systems to ensure fairness, like in health or legal predictions. The footgun is deploying a model without one, risking misuse.

Model Serving: Turning Trained Models into Live APIs
Model serving wraps a trained machine learning model in an API, making it a live service that can generate predictions. It's how you power features like real-time fraud detection or product recommendations.

Model Versioning: Git for Your ML Models
Think of model versioning as "Git for data." It tracks large models and datasets alongside your code without bloating your Git repo. Use it to reproduce old experiments or roll back to a better-performing model. The footgun is versioning only code, not data.
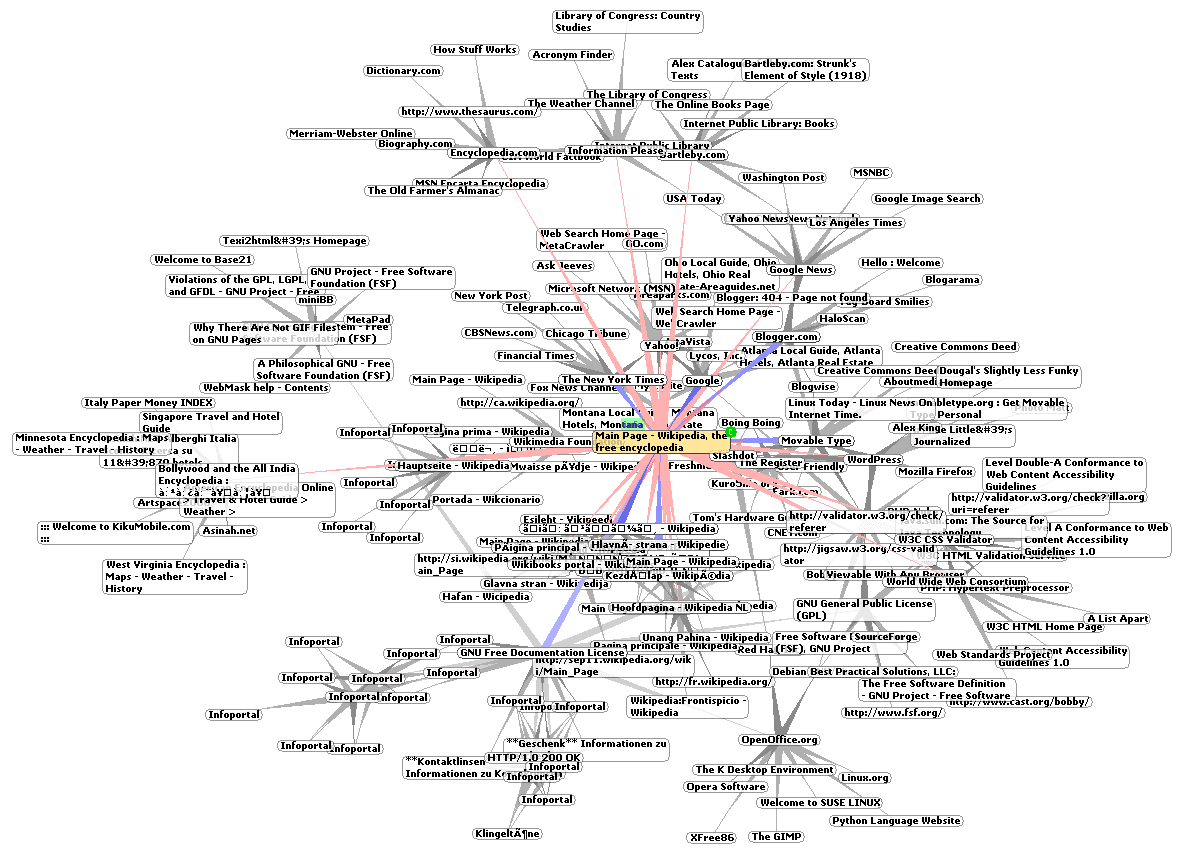
Network Visualization: Making Sense of Connections
Network visualization turns abstract relationships into a 2D map. It's used to see structure in social networks or biological pathways. The footgun is that layout choices can create misleading patterns; a pretty graph isn't always a true one.

Interactive Data Viz: Let Users Explore the Data
Interactive data viz turns a static report into a conversation, giving users controls to ask their own questions. It's key for BI dashboards and research tools. The footgun is overwhelming users with too many options, creating confusion instead of clarity.
Pre-attentive Attributes: Your Brain on Autopilot
Pre-attentive attributes are visual properties your brain processes in milliseconds, before you consciously focus. They're the workhorses of data visualization, making outliers and patterns pop out of a dashboard. The biggest mistake is using too many at once.

Chartjunk: Less is More in Data Visualization
Chartjunk is visual noise in a graph that doesn't help the user understand the data, like 3D effects or decorative backgrounds. It's common in reports where aesthetics are prioritized over clarity.
Audience Analysis: Translate Data for Your Listener
Don't just show data; translate it for your audience. Audience analysis means tailoring communication to who's listening, based on their knowledge and needs. The biggest mistake is assuming your audience shares your context and jargon—they rarely do.
We are hiring for this. Every open role lists the topics its interview covers, so you can prepare for the real thing rather than guessing.
See open roles