Everything in Data Science & Analytics, page 5

High ROC-AUC but low PR-AUC: what does this imply?
Tests if ROC-AUC hides imbalance while PR-AUC exposes it. Severe imbalance dilutes FPR across many negatives, inflating ROC-AUC, but precision crashes. Critical for rare positives with costly false positives. Praising the model on ROC-AUC alone fails.

What is cross-validation and why is it more robust than a holdout split?
A single split is noisy and wastes data; k-fold rotates each fold as test, averages scores, and trains on all data.

How would feature engineering for categoricals differ for logistic regression versus LightGBM?
It tests model-specific encoding decisions. Logistic regression needs one-hot to avoid false ordinality; tree models like LightGBM use ordinal encoding since splits rely on thresholds, not distance.

Explain bias-variance tradeoff and how regularization or tree depth manage it
Tests understanding of generalization error decomposition. Define bias as underfitting and variance as sensitivity to training noise; show regularization and shallow trees trade excess variance for slightly higher bias. Red flag: claiming both can hit zero.
How does K-Means clustering work and how do you choose K?
Tests centroid-based partitioning and hyperparameter tuning. Explain iterative assignment to nearest means and variance reduction, then cite elbow method, silhouette score, or domain knowledge for K. Red flag: choosing K without quantitative justification.
Why is accuracy misleading for fraud detection, and what metrics instead?
Tests recognition of class imbalance. A good answer notes that labeling all transactions as legitimate gives 99% accuracy while catching zero fraud, then recommends precision, recall, F1, and AUC-PR. Red flag: defending accuracy or ignoring false negatives.
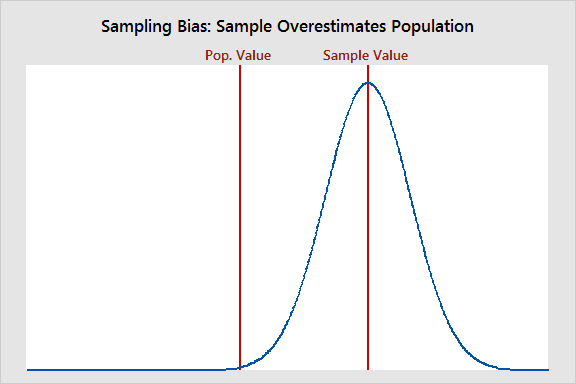
How can EDA and visualization identify dataset bias before modeling?
Tests operationalizing bias detection before modeling. Strong answers compare sample distributions to population norms, audit feature coverage with heatmaps, and track missingness by subgroup. Red flag: citing only class imbalance or ignoring sampling frame.

Describe your systematic approach to interpreting an 8-feature pair plot
Check 8 diagonals for skew; scan 28 off-diagonals for nonlinear trends, variance patterns, and hue clusters; flag redundancy; spot outliers.
How would you visualize high-cardinality categorical relationships?
This tests dimensionality reduction when categories exceed roughly fifty levels. A strong answer proposes top-N aggregation with an other bucket and density or hierarchy plots like heatmaps or treemaps. A red flag is scrolling a bar chart or sampling rows.
How does a U-shaped EDA pattern influence feature engineering?
Add age squared or splines; trees handle splits but explicit terms aid linear models.

How do you visualize clusters in 100-dimensional numerical data?
Tests PCA versus t-SNE tradeoffs for high-dimensional visualization. Strong answers use PCA first for global variance and outliers, then t-SNE with perplexities 5-50 run to stability. Red flag: interpreting t-SNE cluster sizes or distances as literal metrics.
How do you detect and handle outliers in multivariate datasets?
This tests statistical judgment beyond univariate thresholds. A strong answer names multivariate methods like Mahalanobis distance or isolation forests, PCA or pair plots for visualization, and checks for measurement error before removal.
Explain correlation vs causation and heatmap limitations in EDA
Tests whether you distinguish association from causal mechanism. A strong answer defines both, shows heatmaps spot multicollinearity in EDA, and warns that color ignores confounders and non-linear links. Red flag: claiming high correlation proves causation.
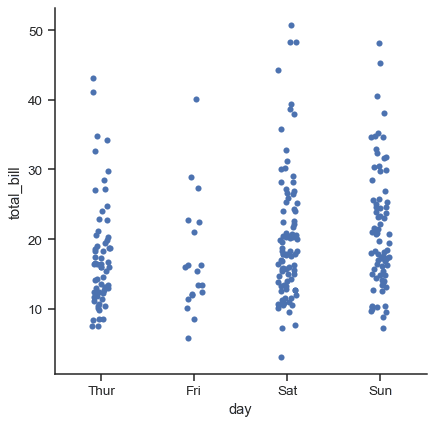
Which plot visualizes a continuous versus categorical variable and why?
This tests categorical plot selection for continuous vs categorical relationships. A strong answer names boxplots or violinplots for distribution shape and outliers, or swarmplots for density, and cites median spread, skew, and anomalies.
First steps to identify and handle missing values
Tests systematic diagnosis before imputation. Strong answers visualize nulls, classify MCAR/MAR/MNAR, and contrast mean imputation with KNN, weighing bias versus complexity.
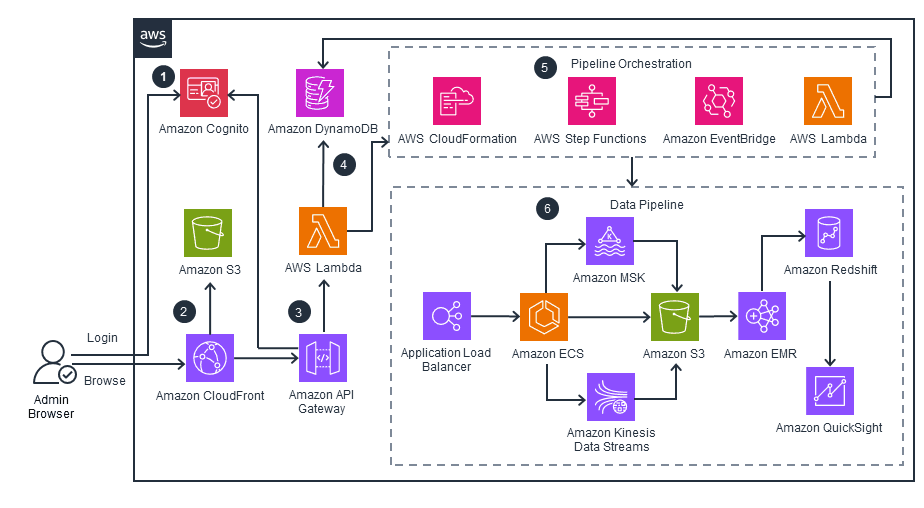
Design a clickstream pipeline from ingestion to data warehouse
Tests data pipeline design under load: buffering, idempotent transform, and warehouse modeling. A strong answer orders ingestion via Kinesis or MSK, Spark EMR sessionization, and Redshift star schemas. Red flag: no buffer and direct warehouse writes.

How would you monitor data quality for a C-level dashboard pipeline?
Designing production data observability for executive dashboards. A strong answer maps freshness SLAs, completeness checks, and distribution drift detection to business impact.

When is streaming better than batch, and what are its infrastructure challenges?
Tests if you separate low-latency decisions from analytics and know ops pain. Good answer: fraud detection vs batch; cite exactly-once, state recovery, backpressure, schema drift. Red flag: calling streaming faster batch while ignoring backpressure or state.
How would you partition a massive user events table?
Tests whether you map query patterns to storage layout to cut bytes scanned. Strong answers pick time-based partitioning for range pruning, cluster by high-cardinality filters, and justify against WHERE clauses.

What is data pipeline idempotency and how do you design for it?
This tests resilient pipeline design under failure. A strong answer defines idempotency as identical output on repeated runs, highlights safe retries and partial failure recovery, and proposes idempotency keys with atomic writes for daily API loads.
We are hiring for this. Every open role lists the topics its interview covers, so you can prepare for the real thing rather than guessing.
See open roles