Intermediate concepts in Product Management, page 14
The 3 Cs: Card, Conversation, Confirmation
A user story isn't a spec; it's a promise for a conversation. The 3 Cs model this: the Card is a placeholder, the Conversation clarifies requirements, and the Confirmation defines "done" with acceptance criteria.
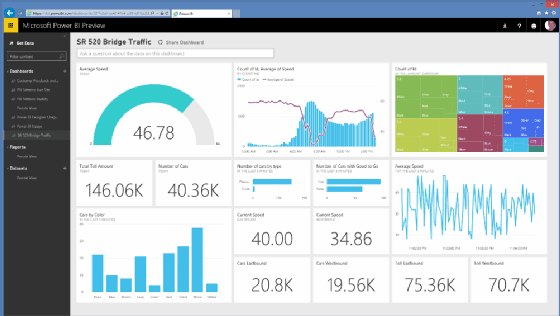
Self-Service Analytics: Let Teams Answer Their Own Data Questions
Self-service analytics gives business teams tools like Power BI to explore data and build reports without waiting for an analyst. This speeds up decision-making by giving teams direct data access.
Story Points: Estimating Effort, Not Time
Story points measure effort, not hours. They combine a task's complexity, uncertainty, and volume into a single relative number. Agile teams use them to forecast work capacity.

Data Visualization: Telling a Story with Data
Data visualization turns raw numbers into graphics that reveal hidden patterns. It’s about designing visuals to help people quickly explore and interpret complex information, like using infographics to convey a concise message to the public.
Story Splitting: Delivering Value in Smaller Slices
Story splitting breaks large user stories into smaller, independent pieces that still deliver value, like slicing a cake vertically so each piece has all layers. This is crucial for fitting work into a sprint and getting faster user feedback.

Experimentation Culture: Data Over Opinions
An experimentation culture prioritizes data over intuition, treating business ideas as testable hypotheses. It's crucial in product development for A/B testing features and UI. The footgun is only testing minor tweaks instead of challenging core assumptions.

The Scrum Board: Visualizing the Sprint's Workflow
A Scrum board is a visual snapshot of a team's work in a sprint, making progress and bottlenecks obvious. Teams use it to track tasks from "To Do" to "Done," ensuring alignment. The footgun: mistaking the board for Scrum itself; it's a helpful tool, not.
Swarming: The Team Tackles One Thing at Once
Swarming focuses the entire team's effort on a single work item to finish it fast, rather than having everyone work on separate tasks. Use it to unblock a critical feature or push the most important story over the finish line at the end of a.
The North Star Metric: Your Product's One True Focus
A North Star Metric (NSM) is the single number that best captures the core value your product delivers. It's a compass for long-term growth, guiding sprint planning and backlog prioritization.

Vanity vs. Actionable Metrics: Measure What Matters
Actionable metrics are levers that change business outcomes; vanity metrics are scoreboard numbers that feel good but don't inform decisions. Use this distinction when setting KPIs to avoid the footgun of celebrating 'total downloads' over actual retained…
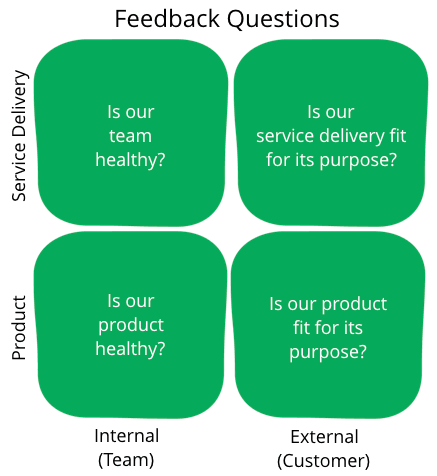
Service Delivery Review: The Missing Agile Feedback Loop
A Service Delivery Review shifts focus from *what* was built to *how* it was delivered. It's a regular meeting where teams and customers review quantitative metrics like lead time and blockers.

The North Star Metric: A Single Focus for Product Strategy
A North Star Metric is the one number that best captures the core value your product delivers to customers. It aligns entire teams on a single goal, simplifying prioritization and reducing wasted work. The footgun is mistaking revenue for a North Star.

Cycle Time: Measuring Your 'Time to Value'
Cycle time is the total duration from a feature's conception to its deployment in production. Agile teams track it to speed up feedback loops and value delivery. The main footgun: start and stop times are inconsistent, making cross-team comparisons unreliable.

AARRR Framework: Pirate Metrics for Growth
The AARRR framework models your business as a five-stage customer funnel: Acquisition, Activation, Retention, Referral, Revenue. It's used to pinpoint leaks in your growth engine. The footgun is tracking raw counts instead of conversion rates between stages.
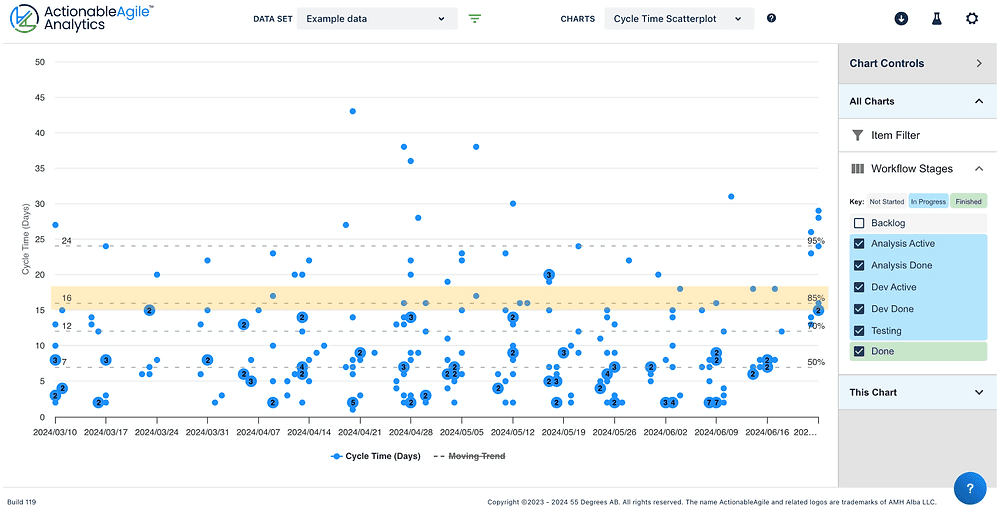
Cycle Time Scatterplot: Visualize Your Team's Predictability
A Cycle Time Scatterplot visualizes delivery speed by plotting how long each task took against its completion date. Agile teams use it to spot predictability trends and set realistic delivery forecasts.
The HEART Framework: Measuring User-Centric Success
The HEART framework measures user-centric success, not just clicks. It provides five categories (Happiness, Engagement, Adoption, Retention, Task Success) to track product health.
Disciplined Agile: A Toolkit, Not a Prescription
Disciplined Agile (DA) is a toolkit, not a rigid framework, for choosing your own process. It helps teams blend practices from Scrum and Lean when one method doesn't fit. The footgun is treating DA as a prescription instead of a decision-making guide.
Marketing Attribution: Deciding Who Gets Credit for a Conversion
Attribution modeling decides which marketing touchpoint gets credit for a conversion. It's used to justify ad spend by assigning value to channels like email, social, or search. The biggest footgun is using a simple model that overvalues the final click.
Agile Maturity Models: A Map, Not a Race
An Agile Maturity Model is a report card for your process, assessing adherence to Agile values through defined levels. Teams use it to benchmark progress and find weak spots.
Sessionization: Turning Raw Events into User Stories
Sessionization groups a user's raw clicks and page views into a single "visit." It's used to analyze conversion funnels and calculate metrics like time-on-site. The main footgun: your definition of a "session" is arbitrary and can skew results.
We are hiring for this. Every open role lists the topics its interview covers, so you can prepare for the real thing rather than guessing.
See open roles