Concepts in Product Management, page 5

Focus Groups: Understanding the 'Why' Behind User Reactions
A focus group is a guided conversation to uncover the 'why' behind user opinions, not just what they are. It's used to gauge reactions to new products or understand shared experiences.

The IKEA Effect: Why We Overvalue What We Build
The IKEA effect is our tendency to overvalue things we help build. It's used in products that let users customize profiles or dashboards, increasing their investment. The footgun: if the task is too hard or fails, users feel incompetent and abandon it.
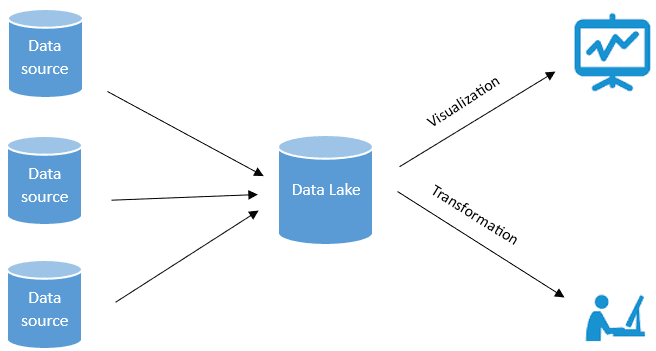
Data Lake: Store Raw Data Now, Analyze It Later
A data lake is a central repository that holds vast amounts of raw data in its native format. This "store now, structure later" approach is ideal for machine learning on original, unfiltered source data.
User Stories: Features from the User's Perspective
A user story is an informal, natural language description of a software feature from the end user's viewpoint. Used in agile development, they're written by stakeholders like clients or developers on Post-its or in apps.
Ethnography: Uncover Needs Users Can't Articulate
Ethnography uncovers user needs by observing them in their natural environment, not just asking questions. It reveals what people *do*, not just what they say. Use it for early discovery to find needs users can't articulate.
The Endowment Effect: We Overvalue What We Already Own
We irrationally value things more simply because we own them. This appears in free trials that create a sense of ownership, making users less likely to cancel. The footgun is assuming users judge value objectively; they don't, and will resist switching.

Data Marts: Your Department's Slice of the Data Warehouse
Think of a data mart as a department's personal slice of the main data warehouse, containing only relevant data. This allows teams like Sales or Marketing to run faster, focused queries. The footgun is letting each team define shared terms differently.
Minimum Viable Product (MVP): Learn Faster with Less Code
An MVP is the smallest product version that delivers value to early users and provides feedback for future development. Use it to test a business hypothesis with minimal resources, like a single-feature app.

Thematic Analysis: Finding Patterns in Qualitative Data
Thematic Analysis finds patterns in qualitative data, like sifting user interviews for recurring ideas. It's about interpreting meaning, not just counting words. Use it on feedback to understand needs.

Hypothesis-Driven Development: Test Your Ideas Before You Build
Hypothesis-Driven Development treats product work as a series of experiments, not a to-do list. You state a testable belief ("If we build X, users will do Y") before writing code. This de-risks new features by validating ideas early.
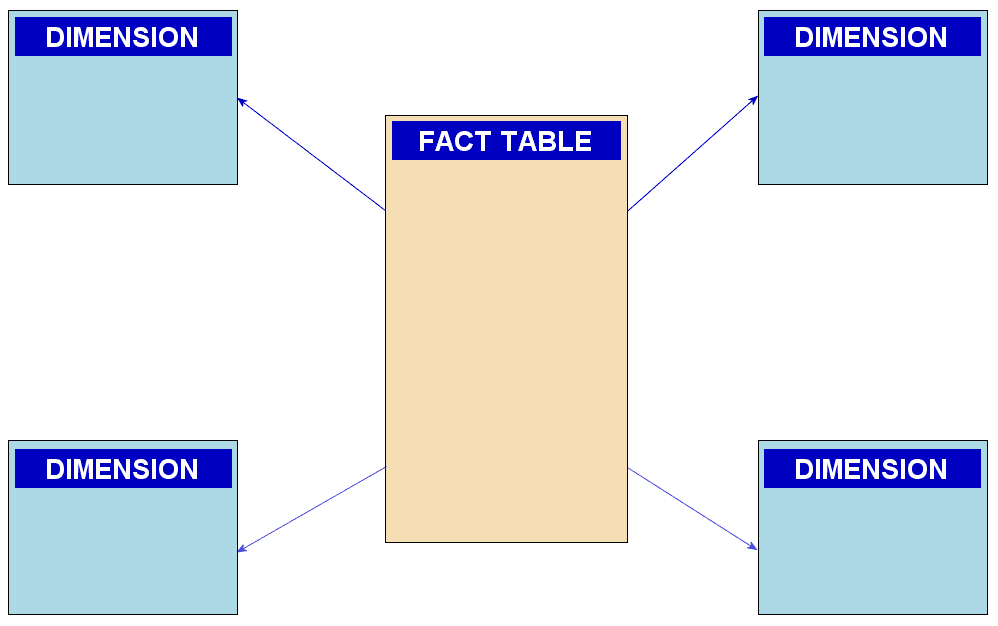
Star Schema: The Blueprint for Analytics Data
A star schema organizes analytics data with a central fact table (e.g., sales) surrounded by dimension tables (e.g., customers). It's built for fast queries in data warehouses. The footgun is normalizing dimensions, which negates its speed advantage.
Five Whys: Find the Root Cause, Not Just the Symptom
Five Whys is a tool for digging past surface-level problems. By repeatedly asking "Why?", you trace a chain of causality back to the true root cause. It's used in post-mortems to find systemic issues, not just patch symptoms. The footgun is stopping too soon.
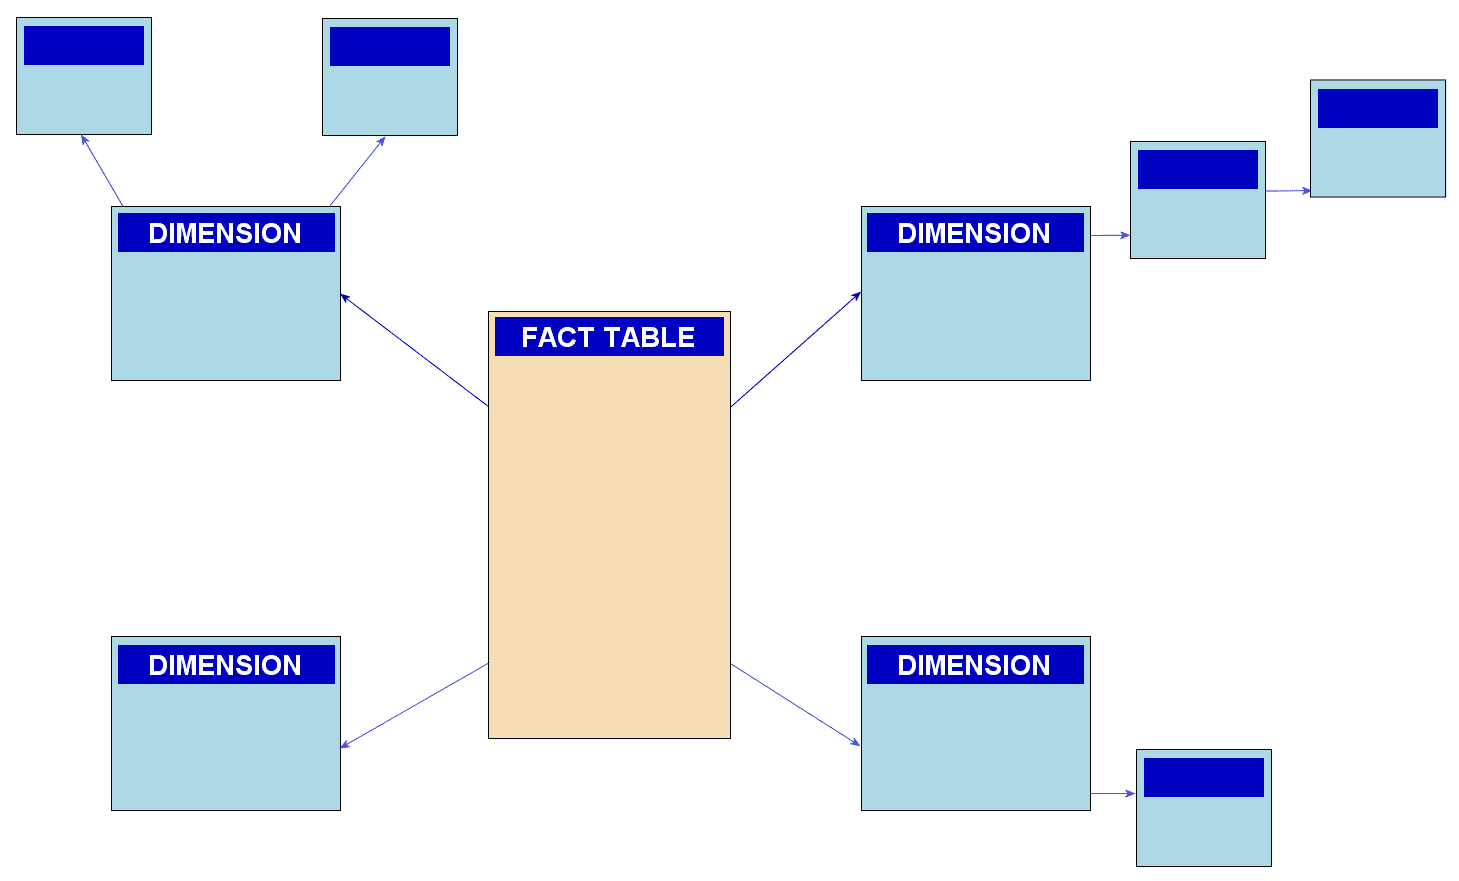
Snowflake Schema: Trading Query Speed for Storage
A snowflake schema saves storage by normalizing a star schema's dimensions into smaller, related tables. It's used in data warehouses to reduce redundancy, but the extra joins required can slow down queries, making it a trade-off against a simpler star schema.

The MoSCoW Method: Prioritizing for Fixed Deadlines
The MoSCoW method protects deadlines by sorting work into four buckets: Must Have, Should Have, Could Have, and Won't Have this time. It's used in agile projects with fixed timelines to ensure critical features ship.

The Competitive Matrix: Visualizing Your Strategic Edge
A competitive matrix is a map of your market, plotting your product against rivals on key axes like price and features. Use it to spot market gaps, justify new features, or refine pricing.

The RICE Scoring Model: Prioritize with Data, Not Feelings
RICE is a formula—(Reach × Impact × Confidence) / Effort—for scoring competing features. It replaces gut feelings with a data-driven framework for prioritizing product roadmaps. The biggest footgun is treating the score as gospel, not a conversation starter.
Change Data Capture (CDC): Turn Your Database Into a Stream
Change Data Capture (CDC) turns your database into a real-time stream of change events (inserts, updates, deletes). It's used to sync data across systems, like updating search indexes or feeding analytics warehouses, without full table scans.
User Story Mapping: From Backlog to Value Map
User Story Mapping reframes your backlog from a feature list into a map of the user's journey, focusing on delivering outcomes customers value. It helps teams prioritize work by visualizing the whole experience.
Perceptual Mapping: Charting How Customers See Your Brand
A perceptual map charts your brand's position based on customer views, not your own. It's a reality check on how you're perceived against competitors on axes like price vs. quality. The biggest footgun is mapping based on internal beliefs, not customer data.
Minimum Detectable Effect: How Small a Change Can You See?
Minimum Detectable Effect (MDE) is the smallest change your A/B test can reliably see. You calculate it *before* a test to determine the sample size needed.
We are hiring for this. Every open role lists the topics its interview covers, so you can prepare for the real thing rather than guessing.
See open roles