Everything in Product Management, page 44
Feature A correlates with retention. Should we invest more?
Tests your ability to move beyond clichés to propose concrete analysis. A great answer questions the correlation, suggests cohort analysis or A/B testing, and probes for confounding variables. Red flag: just saying 'correlation isn't causation' with no plan.

How would you design a product management dashboard?
Tests your ability to structure data into a decision-making narrative. A good answer moves from a high-level summary (DAU) to trends (retention) and then actionable details (feature adoption). A red flag is simply listing charts without a narrative connection.
Bar Chart vs. Line Chart for Market Share Comparison?
Tests basic chart selection: comparing static categories vs. showing trends. A bar chart is correct for comparing discrete companies at one point in time. A line chart wrongly implies a time-series relationship. Red flag: choosing a line or pie chart.

When is a pie chart an appropriate choice for visualization?
Tests data viz principles for part-to-whole data. A good answer defines this use case, gives a clear example (market share), and lists pitfalls like too many slices or similar values. A red flag is defending them for complex data or time-series analysis.

How do you manage an event schema change?
This tests your understanding of data contracts and backward compatibility. A great answer details a phased, backward-compatible rollout (add nullable field), starting with consumers (warehouse) then producers, and mentions using a schema registry for…
Challenges of Grouping by a High-Cardinality Dimension
This tests your grasp of how data shape impacts system resources. A great answer explains that high cardinality explodes memory usage for aggregation state, increases CPU load, and hurts storage compression.
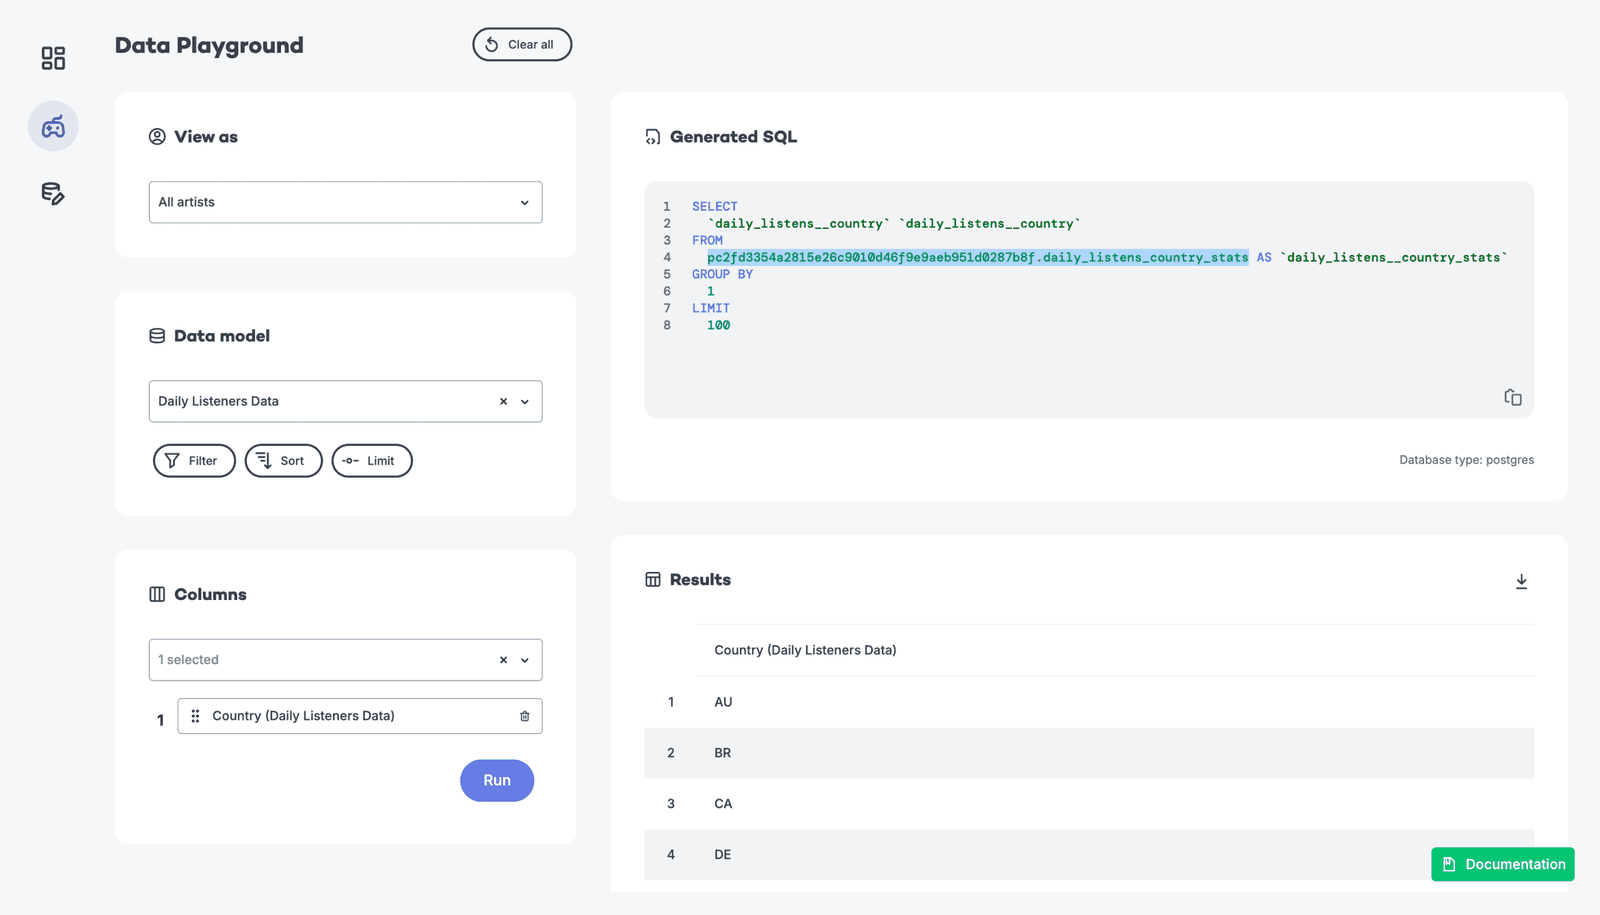
Trade-offs: Pre-aggregation vs. querying raw event data
This tests your grasp of data engineering trade-offs for analytics dashboards. A great answer contrasts pre-aggregation (fast, cheap, stale) with on-the-fly queries (slow, costly, fresh) and mentions hybrid solutions.

How do you ensure accurate counts with duplicate analytics events?
Tests your grasp of data integrity under at-least-once delivery. Explain why COUNT(*) is inflated, then propose deduplication using a unique event ID. Mention trade-offs of stateful processing. A red flag is ignoring the cost or the need for a unique ID.
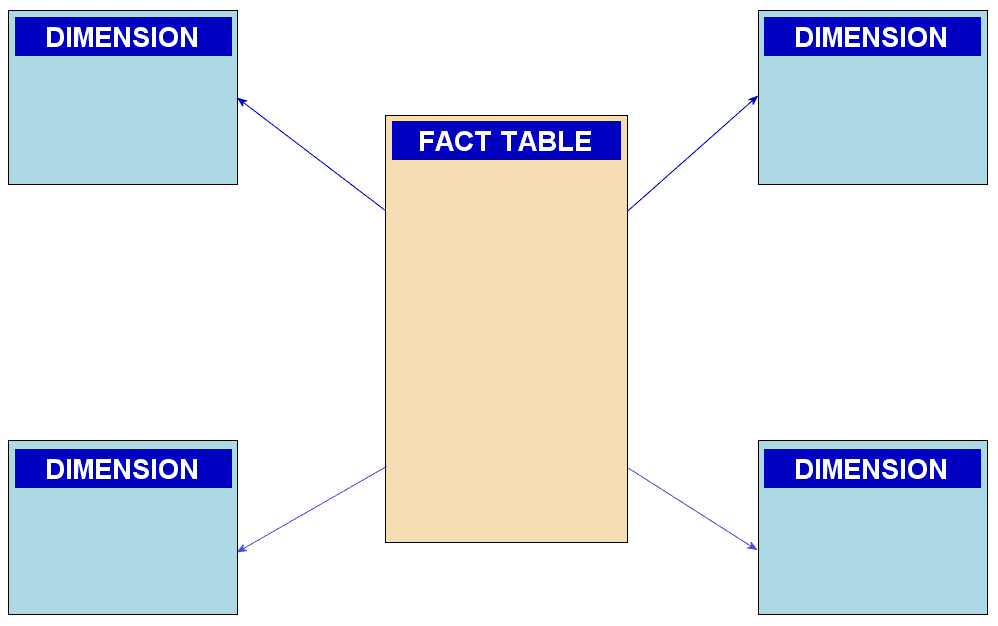
Explain a star schema and its advantages for analytics
Tests your grasp of data modeling trade-offs for OLAP vs. OLTP. A good answer defines fact/dimension tables, then explains how denormalization and fewer joins improve query speed for analytics. A red flag is confusing it with a snowflake schema.

How would you diagnose a slow dashboard query?
This tests your systematic approach to performance tuning. A great answer investigates query optimization, strategic indexing/partitioning, and the data model (like star schema).
Why use p50/p95 over mean for API response times?
Tests your grasp of statistical distributions for UX metrics. A good answer explains how outliers skew the mean, while percentiles (p50, p95) better represent typical and worst-case user experiences.
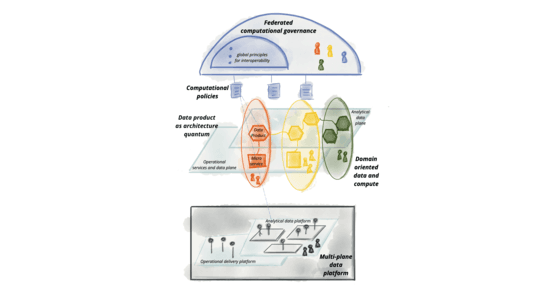
Design a Scalable Data Governance Framework
This tests your grasp of decentralized data governance (Data Mesh). A great answer outlines four principles: domain ownership, data as a product, a self-serve platform, and federated computational governance.
How would you debug a critical data quality issue in a pipeline?
Tests your systematic debugging of a distributed system under pressure. A great answer contains the impact, traces data lineage backward from the report to the source, and then proposes preventative tooling.
How do you create a 'golden record' for customers?
Tests your grasp of data governance and systems thinking. A strong answer defines master data, outlines a phased approach (discovery, rule-setting, implementation), and covers ongoing stewardship.
How to handle schema evolution in a CDC analytics pipeline?
This tests your ability to design resilient CDC pipelines. A strong answer outlines automated schema detection, using a flexible format like Avro, and enforcing governance with a schema registry. A red flag is proposing manual fixes for every change.
Explain data lineage and how you'd implement it
Tests your practical data governance knowledge. Define lineage (origin, transforms, movement), then outline a solution: metadata collection from services, a central store (graph DB), and a visualization tool (Amundsen/OpenLineage).

What is a data schema and why enforce it on ingestion?
This tests your grasp of data governance. Define a schema as a data blueprint. Explain that enforcement on ingestion prevents "garbage in, garbage out" by validating types and formats, ensuring data is usable for analytics.
How would you validate user-submitted email addresses at ingestion?
Tests your understanding of data validation beyond simple regex, focusing on robustness and system-level thinking. A good answer covers format checks, DNS/MX record validation, and blocking disposable services.
How would you handle 10% nulls in a key column?
This tests your ability to diagnose data issues before solving. First, investigate why data is null. Then, discuss trade-offs of dropping vs. imputing with the mean or median, considering the impact on the dashboard's accuracy.

Design a data quality framework for a modern data platform.
Tests your ability to design a systematic data quality strategy. A great answer outlines a framework starting with governance (roles), then profiling/assessment, defining standards, and finally implementing pipeline controls.
We are hiring for this. Every open role lists the topics its interview covers, so you can prepare for the real thing rather than guessing.
See open roles