All bites
The whole library, newest first. Filter by what you are here for, or pick a topic if you already know.
4330 bites
Page 113
How do you create a 'golden record' for customers?
Tests your grasp of data governance and systems thinking. A strong answer defines master data, outlines a phased approach (discovery, rule-setting, implementation), and covers ongoing stewardship.
How do you root-cause bad data across microservices and Spark?
This tests structured debugging and observability for distributed pipelines. A strong answer isolates the break via lineage, validates schema and freshness per stage, and compares microservice outputs to Spark inputs.
How do you debug a data quality issue in a complex pipeline?
Tests systematic debugging in distributed systems. A great answer prioritizes containment, traces data lineage from report to source, and proposes specific observability tools.
How would you debug a critical data quality issue in a pipeline?
Tests your systematic debugging of a distributed system under pressure. A great answer contains the impact, traces data lineage backward from the report to the source, and then proposes preventative tooling.
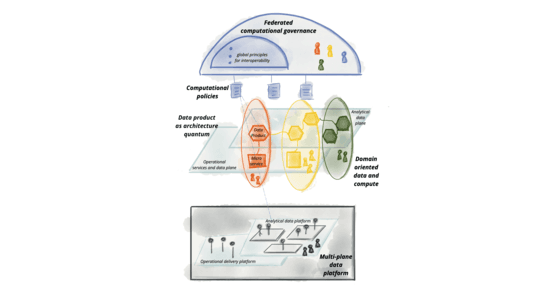
Design a scalable data governance framework balancing autonomy and control
Self-serve platform with domain products, auto-catalog, schema contracts, and policy-as-code access in CI/CD.
Design a Scalable Data Governance Framework
This tests your grasp of decentralized data architectures like Data Mesh. A great answer proposes a federated model with domain ownership, data as a product, and a self-serve platform.
Design a Scalable Data Governance Framework
This tests your grasp of decentralized data governance (Data Mesh). A great answer outlines four principles: domain ownership, data as a product, a self-serve platform, and federated computational governance.
Why prefer median and p95 over mean for API latency?
This tests statistical intuition for skewed distributions. A strong answer notes that median captures typical experience, p95 captures tail suffering, and mean hides outliers. A red flag is claiming mean alone is sufficient.
Why use median/p95 for API latency instead of the mean?
This tests if you understand how long-tail distributions make averages misleading for user experience. A good answer explains that median (p50) shows the typical user, while p95 captures the worst-case experience.
Why use p50/p95 over mean for API response times?
Tests your grasp of statistical distributions for UX metrics. A good answer explains how outliers skew the mean, while percentiles (p50, p95) better represent typical and worst-case user experiences.
Slow dashboard querying a large fact table: first three checks?
This tests systematic diagnosis of fact-table query latency. A strong answer checks the execution plan and indexing, evaluates partitioning and data model fit, and inspects caching or pre-aggregation.
How to diagnose a slow dashboard query?
This tests systematic debugging of a data problem. A good answer investigates the query plan first, then the table's physical layout (partitioning/clustering), and finally the BI tool and warehouse load. A red flag is jumping to a solution without diagnosis.
How would you diagnose a slow dashboard query?
This tests your systematic approach to performance tuning. A great answer investigates query optimization, strategic indexing/partitioning, and the data model (like star schema).
Why is star schema preferred over 3NF for analytics?
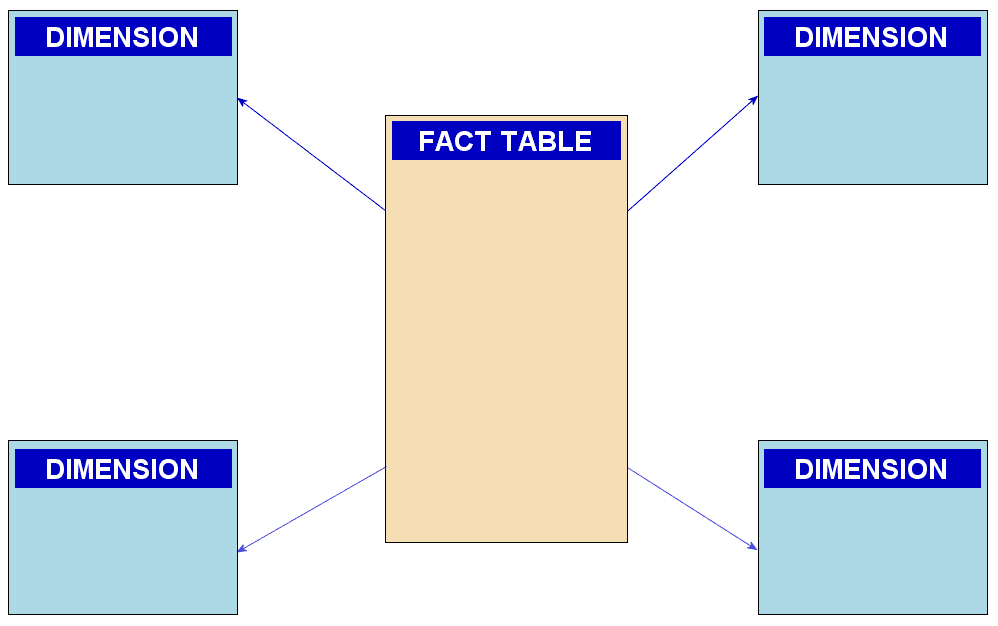
Tests your grasp of the read-performance trade-off in analytical schemas. A great answer names fact and dimension tables, emphasizes fewer joins for aggregations, and cites simpler SQL and faster query plans.
Explain the star schema and its advantages for analytics
This tests your grasp of OLAP vs. OLTP data modeling. A great answer defines fact/dimension tables, explains how denormalization leads to fewer joins and faster queries, and contrasts this with 3NF's focus on write integrity.
Explain a star schema and its advantages for analytics
Tests your grasp of data modeling trade-offs for OLAP vs. OLTP. A good answer defines fact/dimension tables, then explains how denormalization and fewer joins improve query speed for analytics. A red flag is confusing it with a snowflake schema.

How do duplicate events bias COUNT(*) and daily login reports?
Tests idempotency in streaming analytics. COUNT(*) overcounts; fix with unique event ID dedup via idempotent writes or COUNT(DISTINCT id), plus daily partition reconciliation. Red flag: SELECT DISTINCT * without a stable key or no reporting safeguard.
How do you handle duplicate events in an analytics pipeline?
Tests your grasp of data integrity and idempotent processing. Explain how duplicates inflate COUNT(*), then propose adding a unique event_id and using a stateful stream processor to track seen IDs. Mention query-time COUNT(DISTINCT event_id) as an alternative.
How do you ensure accurate counts with duplicate analytics events?
Tests your grasp of data integrity under at-least-once delivery. Explain why COUNT(*) is inflated, then propose deduplication using a unique event ID. Mention trade-offs of stateful processing. A red flag is ignoring the cost or the need for a unique ID.
Trade-offs between pre-aggregated and raw event data for dashboards
Pre-aggregations trade freshness for speed; raw queries preserve flexibility but spike cost and latency under load.