Intermediate everything in Analytics & Metrics, page 3

Describe dbt's role and how it differs from traditional ETL
Position dbt as ELT's T with lineage, tests, docs; contrast with Python ETL using external compute and Airflow only scheduling tasks.

Random split vs walk-forward validation in forecasting
Random splits leak future data into training; walk-forward validation rolls the origin ahead, testing only on later observations.

What is the difference between a primary metric and a guardrail metric?
Tests whether you distinguish success criteria from safety checks in experiments. A strong answer defines primary metrics as the target outcome, guardrails as protective thresholds, and gives a concrete scenario where a primary lift does not justify shipping…
What is the 'novelty effect' in experimentation?
Tests whether you separate temporary curiosity from durable value. A strong answer defines novelty effect as short-term behavior change triggered by new elements, notes it inflates early experiment lift, and proposes longer runtimes or lagged cohort analysis.
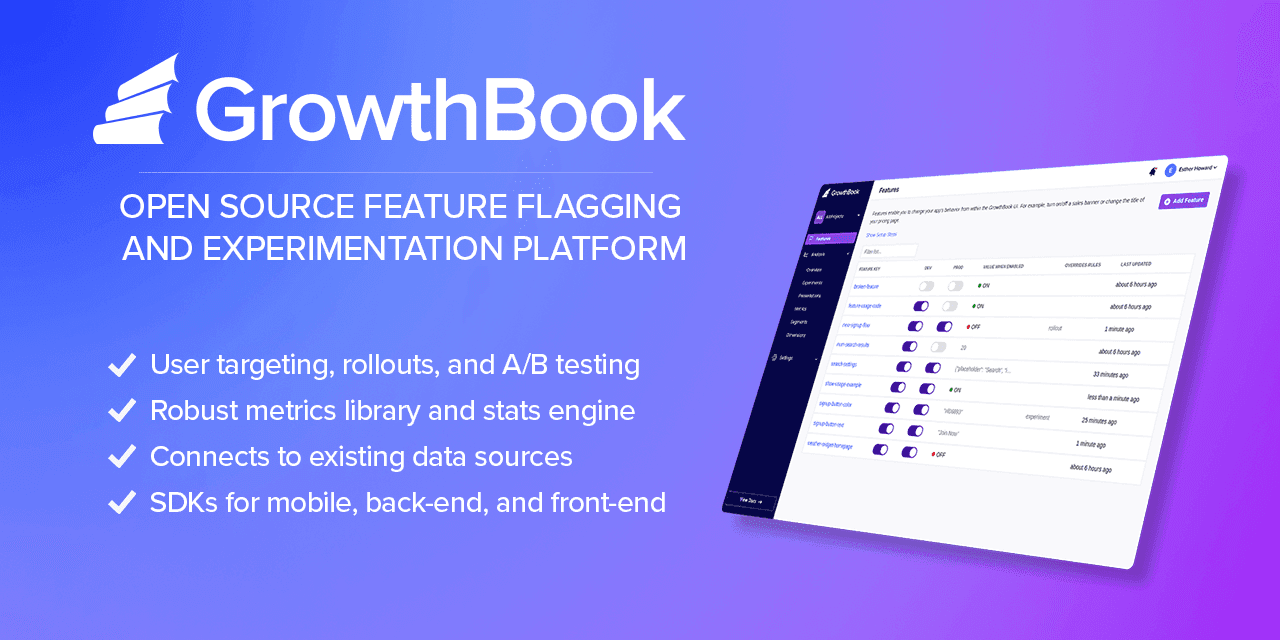
Why is stopping an A/B test at first significance problematic?
Tests peeking and Type I error inflation. Name peeking; explain daily looks inflate false positive rates above nominal alpha; note p-values assume one look at fixed sample size; recommend pre-committed runtimes or sequential testing.
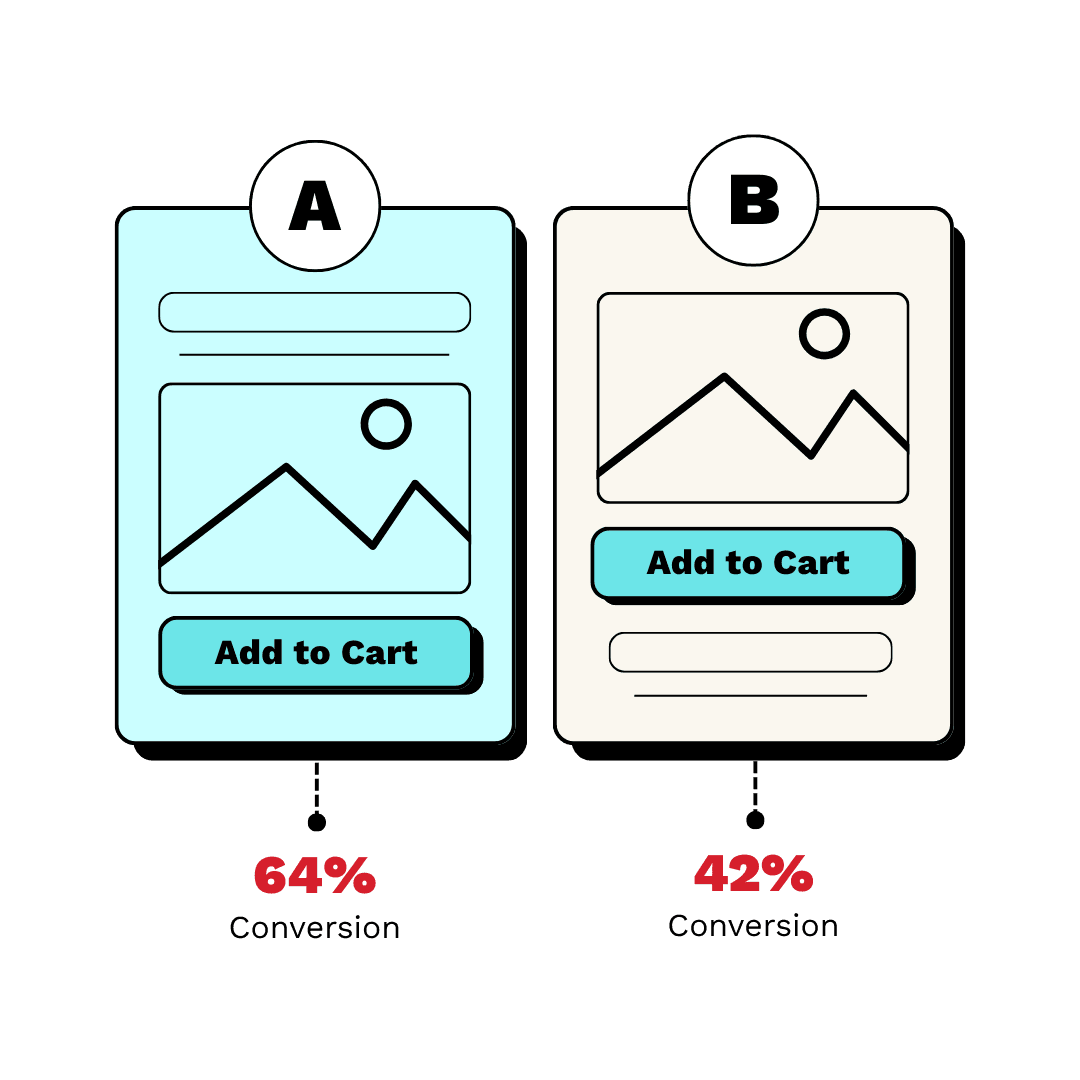
How do you determine sample size and duration for an A/B test?
This tests statistical power literacy. A strong answer names baseline rate, MDE, alpha, and beta; explains the duration versus sensitivity trade-off; and notes traffic allocation. A red flag is ignoring power or stopping early when results look significant.

Explain Simpson's Paradox and construct a user engagement scenario
Tests whether you spot trends reversing when population mixes differ. Good answers define the paradox, give a numerical example with per-segment wins but aggregate loss, and warn against segment-only decisions.
Determine if a 10% DAU drop is statistically significant
Tests signal vs noise in stable metrics. Good answers define a null hypothesis, compute a test statistic from historical variance, compare to a critical value at set alpha, and check seasonality. Red flag: calling a large drop real without baseline variance.
Explain the difference between correlation and causation with a software example.
Tests whether you distinguish association from causation to avoid blaming production issues. A strong answer defines both concepts, names a confounding variable, and gives a software example with a common cause. Red flag: claiming correlation is causation.
A/B test p-value 0.08, PM wants to ship. How do you advise?
Tests statistical rigor versus business pragmatism. A strong answer covers pre-registered thresholds, false positive risk, statistical power, confidence intervals, and the business cost of being wrong. Red flag: shipping without quantifying downside risk.
A/B test shows 5% lift with imbalanced mobile traffic. What next?
This tests sample ratio mismatch and Simpson's paradox. A strong answer says the lift is confounded by platform, demands stratified analysis to isolate the true effect, and checks randomization. A red flag is accepting the 5% lift without questioning skew.

Write SQL to generate a monthly cohort retention table from raw events
Tests window functions and date truncation for cohort analysis. A strong answer finds each user's first month, counts returning users per period, and divides by cohort size. Aggregating all users without isolating acquisition month hides new-user churn.

Average latency up 50ms but p99 flat: diagnose the discrepancy
Tests if you know mean reflects full distribution while p99 is a threshold. Strong answers hypothesize body shift like cache misses or traffic mix changes, and demand histograms and segmentation by endpoint. Red flag: blaming outliers, which would raise p99.

Explain pre-attentive attributes and give three examples
This tests whether you know preattentive attributes are decoded in <200ms to guide attention freely. Name three such as color hue, size, and motion; then encode one variable in a dense scatter plot so targets pop out. Never call this decoration or color all.
Stakeholder claims feature usage drives retention. How do you validate?
Probe confounders, reverse causality, selection bias; propose diff-in-diff or propensity scores; plot lagged usage vs retention.

How would you structure a user engagement dashboard for PMs?
Tests narrative sequencing of metrics across abstraction layers. Strong answer: DAU headline for health, retention cohorts for pattern diagnosis, feature adoption funnels for root-cause drill-down.

How do duplicate events bias COUNT(*) and daily login reports?
Tests idempotency in streaming analytics. COUNT(*) overcounts; fix with unique event ID dedup via idempotent writes or COUNT(DISTINCT id), plus daily partition reconciliation. Red flag: SELECT DISTINCT * without a stable key or no reporting safeguard.
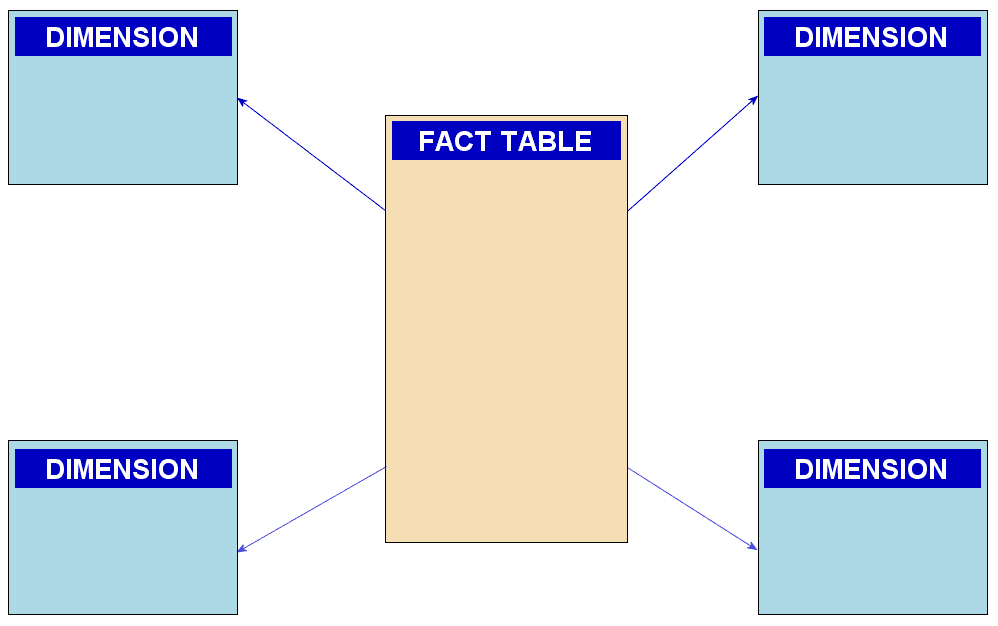
Why is star schema preferred over 3NF for analytics?
Tests your grasp of the read-performance trade-off in analytical schemas. A great answer names fact and dimension tables, emphasizes fewer joins for aggregations, and cites simpler SQL and faster query plans.
Slow dashboard querying a large fact table: first three checks?
This tests systematic diagnosis of fact-table query latency. A strong answer checks the execution plan and indexing, evaluates partitioning and data model fit, and inspects caching or pre-aggregation.
How would you build a Customer golden record across fragmented systems?
This tests master data management discipline for distributed, conflicting records. A strong response covers identity resolution, survivorship rules, merge architecture, lineage, and feedback loops.
We are hiring for this. Every open role lists the topics its interview covers, so you can prepare for the real thing rather than guessing.
See open roles