More in Analytics & Metrics — page 19
How do you handle late-arriving data in a streaming pipeline?
Tests understanding of event time vs. processing time and the mechanisms (watermarks, triggers, allowed lateness) to ensure correctness. Answer by distinguishing time types, using event-time windowing, defining watermarks, and configuring allowed lateness.
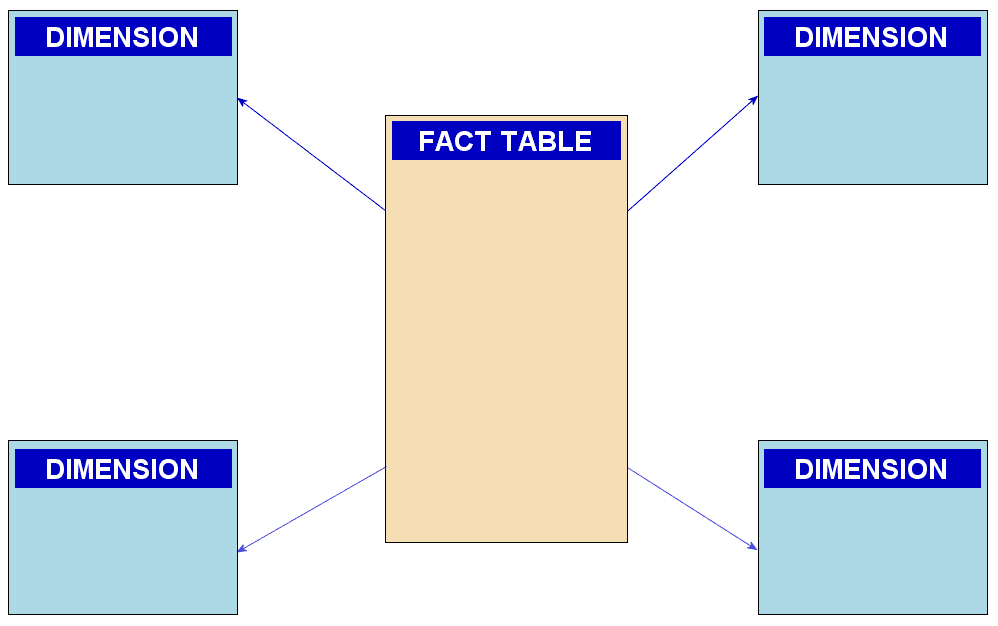
Describe star and snowflake schemas and their trade-offs.
Tests your grasp of data warehouse design trade-offs. Define star (denormalized dimensions) and snowflake (normalized dimensions) schemas. Contrast them: star is faster for queries but uses more space; snowflake is space-efficient but requires more joins.

What is a data warehouse vs. a transactional database?
Tests your grasp of read-optimized (OLAP) vs. write-optimized (OLTP) systems. A great answer defines warehouses for analysis, contrasts them with transactional DBs for operations, and explains the resulting differences in workload, schema, and data structure.
Build a pipeline to load CSVs into a database
Tests your grasp of event-driven architecture and basic ETL. A good answer outlines a trigger (storage event), a processing function (serverless), and a destination (database), mentioning error handling. A red flag is describing a manual or cron-based process.

ETL vs. ELT: Key differences and when to use each?
This tests your understanding of modern data architecture trade-offs. A good answer explains the T vs. L order, then links ETL to structured, legacy systems and ELT to flexible, cloud-native data lakes/warehouses.

Guarantee at-least-once delivery for a critical event?
This tests your grasp of atomicity without 2PC. A great answer outlines the Transactional Outbox pattern: write the event to a DB table in the same transaction as the business logic, then use a relay process. A red flag is relying on simple try/catch blocks.

Design a client-side event batching system for a high-traffic app
This tests your grasp of frontend performance and data reliability. Outline a batching strategy (timer/size), then explain using `visibilitychange` with `navigator.sendBeacon()` to prevent data loss on unload. A red flag is suggesting synchronous XHR.
How do you approach user identity stitching across devices?
This tests your grasp of event-driven data pipelines and identity management. A strong answer outlines an identifier hierarchy, the "stitch" event (login), and a backend process for retroactively applying a canonical user ID.

Build vs. Buy: Third-Party vs. In-House Analytics
Tests your grasp of the time-vs-control trade-off. A great answer weighs speed vs. customization and total cost of ownership. Advocating for 'build' without considering the massive, ongoing maintenance cost is a major red flag.
How would you debug a sudden drop in a key metric?
Tests your systematic debugging of complex data systems. First, validate the drop against a source of truth and segment the data. Then, hypothesize causes like misattribution or data loss.
How do you track page views in a Single Page Application?
This tests your grasp of SPA routing mechanics. A great answer covers both programmatic navigation (using router hooks) and browser history events (`popstate`), explaining why both are necessary.

How would you measure the ROI of a data analytics platform?
This tests your ability to connect platform engineering to business value. A great answer quantifies ROI via cost savings, revenue generation, and risk reduction, then details the systems (e.g., cost tagging, metadata tracking) needed.
How would you design an analytics strategy for a marketplace?
Tests your ability to balance conflicting needs in a complex system. A great answer covers core health (liquidity, match rate), side-specific KPIs (buyer satisfaction, seller utilization), and unit economics (take rate).

Explain the North Star Metric and propose one for a product
Tests your ability to link product strategy to a single metric reflecting customer value and business growth. Define the NSM, propose one for a product like Spotify, and justify it. A red flag is picking a vanity metric like DAU or a pure business metric.

How would you diagnose a flat feature adoption KPI?
This tests your ability to create a diagnostic plan from a single lagging metric. A great answer outlines a funnel (Awareness > Activation > Usage), segments users, and combines quantitative data with qualitative feedback.
Pitfalls of 'Conversion Rate' as a North Star Metric
This tests your ability to see beyond a single metric and understand its second-order effects. A strong answer identifies pitfalls like lower AOV, then proposes counter-metrics (AOV, return rate) and guardrail metrics (page load time).

Translate 'increase engagement' into a technical measurement plan
This tests your ability to translate vague business goals into concrete metrics. First, clarify the goal with the PM. Then, propose specific, measurable proxy metrics (e.g., DAU/MAU, session length). Finally, outline the instrumentation plan.
Evidence-Based Management: Metrics Over Gut Feel
EBM replaces 'I think' with 'I know because the data shows...' It's about making decisions using evidence, not just intuition. Use it to prioritize features with user data or optimize processes by measuring cycle time. The footgun is metric fixation.
RFM Analysis: Find Your Best Customers
RFM analysis segments customers by scoring their Recency, Frequency, and Monetary value. This helps identify your best customers (high RFM), those at risk (low R/F), and new high-spenders.
Bullet Graphs: Packing Context into a Single Bar
A bullet graph packs rich context into one bar, showing a metric against its target and qualitative ranges. Use it on dashboards for single KPIs like sales-to-quota or latency vs. SLA. The footgun is clutter, which defeats its at-a-glance purpose.