More in Analytics & Metrics — page 18

When is a pie chart an appropriate choice for visualization?
Tests data viz principles for part-to-whole data. A good answer defines this use case, gives a clear example (market share), and lists pitfalls like too many slices or similar values. A red flag is defending them for complex data or time-series analysis.

How do you manage an event schema change?
This tests your understanding of data contracts and backward compatibility. A great answer details a phased, backward-compatible rollout (add nullable field), starting with consumers (warehouse) then producers, and mentions using a schema registry for…

Challenges of Grouping by a High-Cardinality Dimension
This tests your grasp of how data shape impacts system resources. A great answer explains that high cardinality explodes memory usage for aggregation state, increases CPU load, and hurts storage compression.
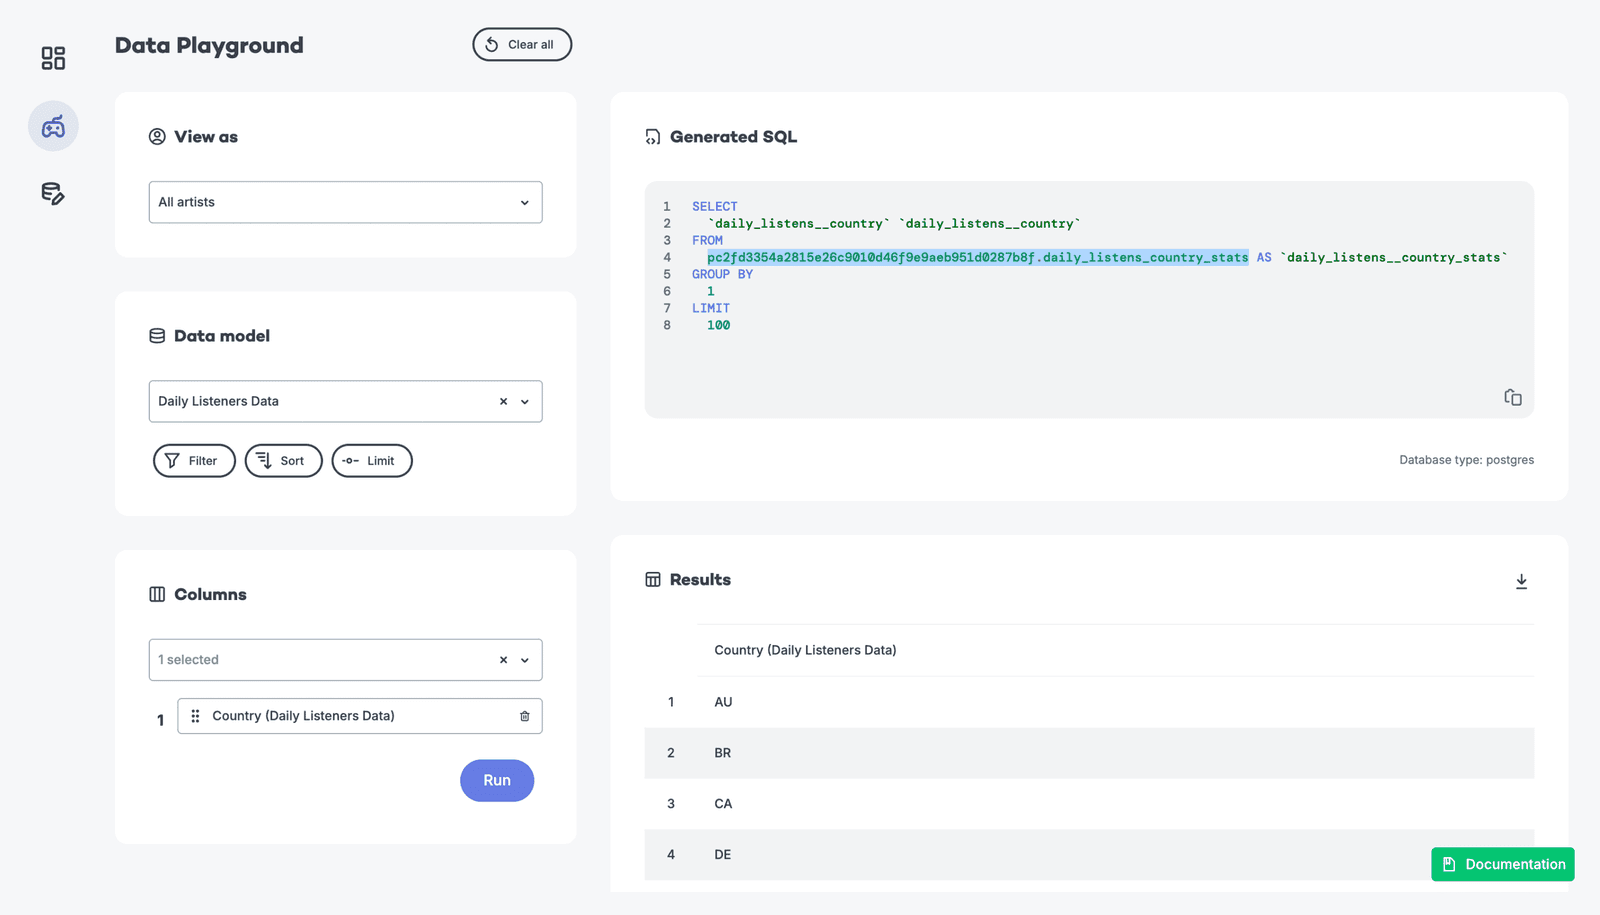
Trade-offs: Pre-aggregation vs. querying raw event data
This tests your grasp of data engineering trade-offs for analytics dashboards. A great answer contrasts pre-aggregation (fast, cheap, stale) with on-the-fly queries (slow, costly, fresh) and mentions hybrid solutions.

How do you ensure accurate counts with duplicate analytics events?
Tests your grasp of data integrity under at-least-once delivery. Explain why COUNT(*) is inflated, then propose deduplication using a unique event ID. Mention trade-offs of stateful processing. A red flag is ignoring the cost or the need for a unique ID.
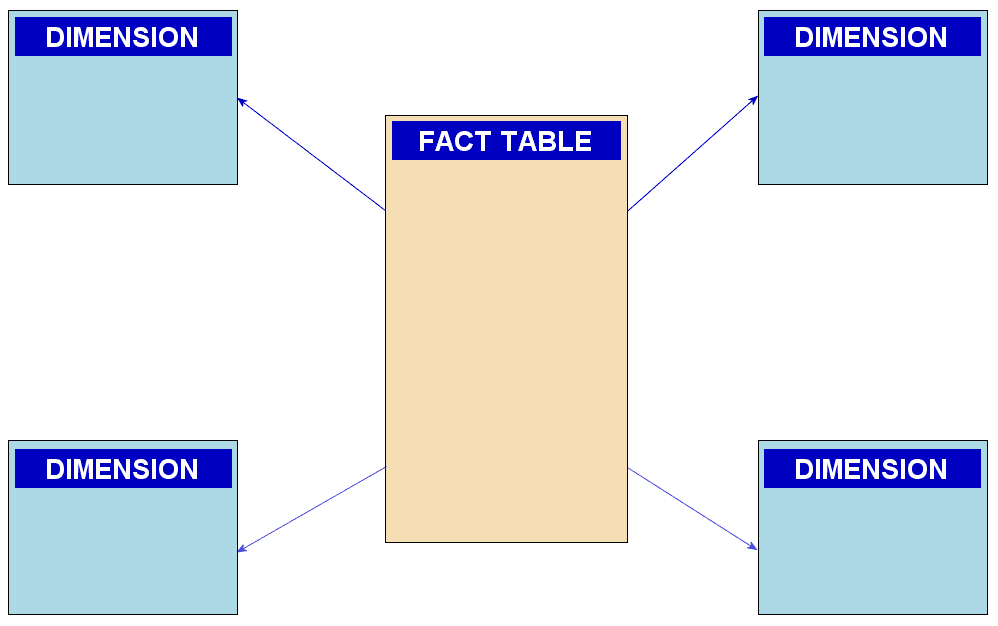
Explain a star schema and its advantages for analytics
Tests your grasp of data modeling trade-offs for OLAP vs. OLTP. A good answer defines fact/dimension tables, then explains how denormalization and fewer joins improve query speed for analytics. A red flag is confusing it with a snowflake schema.

How would you diagnose a slow dashboard query?
This tests your systematic approach to performance tuning. A great answer investigates query optimization, strategic indexing/partitioning, and the data model (like star schema).
Why use p50/p95 over mean for API response times?
Tests your grasp of statistical distributions for UX metrics. A good answer explains how outliers skew the mean, while percentiles (p50, p95) better represent typical and worst-case user experiences.
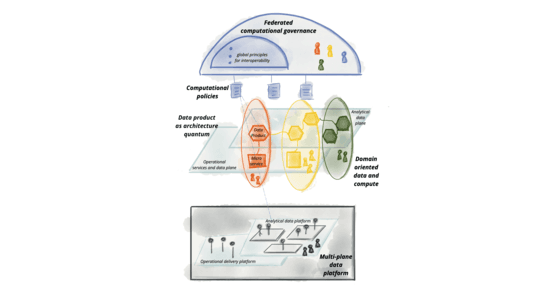
Design a Scalable Data Governance Framework
This tests your grasp of decentralized data governance (Data Mesh). A great answer outlines four principles: domain ownership, data as a product, a self-serve platform, and federated computational governance.
How would you debug a critical data quality issue in a pipeline?
Tests your systematic debugging of a distributed system under pressure. A great answer contains the impact, traces data lineage backward from the report to the source, and then proposes preventative tooling.
How do you create a 'golden record' for customers?
Tests your grasp of data governance and systems thinking. A strong answer defines master data, outlines a phased approach (discovery, rule-setting, implementation), and covers ongoing stewardship.
How to handle schema evolution in a CDC analytics pipeline?
This tests your ability to design resilient CDC pipelines. A strong answer outlines automated schema detection, using a flexible format like Avro, and enforcing governance with a schema registry. A red flag is proposing manual fixes for every change.
Explain data lineage and how you'd implement it
Tests your practical data governance knowledge. Define lineage (origin, transforms, movement), then outline a solution: metadata collection from services, a central store (graph DB), and a visualization tool (Amundsen/OpenLineage).

What is a data schema and why enforce it on ingestion?
This tests your grasp of data governance. Define a schema as a data blueprint. Explain that enforcement on ingestion prevents "garbage in, garbage out" by validating types and formats, ensuring data is usable for analytics.
How would you validate user-submitted email addresses at ingestion?
Tests your understanding of data validation beyond simple regex, focusing on robustness and system-level thinking. A good answer covers format checks, DNS/MX record validation, and blocking disposable services.
How would you handle 10% nulls in a key column?
This tests your ability to diagnose data issues before solving. First, investigate why data is null. Then, discuss trade-offs of dropping vs. imputing with the mean or median, considering the impact on the dashboard's accuracy.

Design a data quality framework for a modern data platform.
Tests your ability to design a systematic data quality strategy. A great answer outlines a framework starting with governance (roles), then profiling/assessment, defining standards, and finally implementing pipeline controls.
How do you debug out-of-memory errors in a Spark job?
Tests your systematic debugging of distributed systems. A great answer diagnoses via the Spark UI, investigates data skew and inefficient code (e.g., shuffles), and only then tunes memory or partition configs. Red flag: immediately increasing executor memory.
Compare a data warehouse, data lake, and lakehouse
Tests your grasp of data architectures for BI vs. ML workloads. Contrast warehouses (structured) and lakes (raw), then explain how a lakehouse adds ACID/schema features to a lake's storage. A red flag is confusing schema-on-write vs. schema-on-read.
What is data partitioning in a cloud data warehouse?
Tests your grasp of performance and cost trade-offs in data systems. A good answer defines partitioning, explains partition pruning for performance, and links it directly to reduced data scan costs.