More in Analytics & Metrics — page 16

Track a user event from frontend code to a BI tool
Tests your understanding of the modern data stack. A good answer traces the event from frontend capture, through an ingestion pipeline, into a data warehouse, and finally to a BI tool for analysis. A red flag is describing only one part of the journey.

Prove API Latency Affects User Engagement
This tests your ability to design a controlled experiment for a backend attribute. A great answer outlines an A/B test that artificially adds latency for a treatment group, details the necessary logging with shared IDs, and explains how to join and analyze…
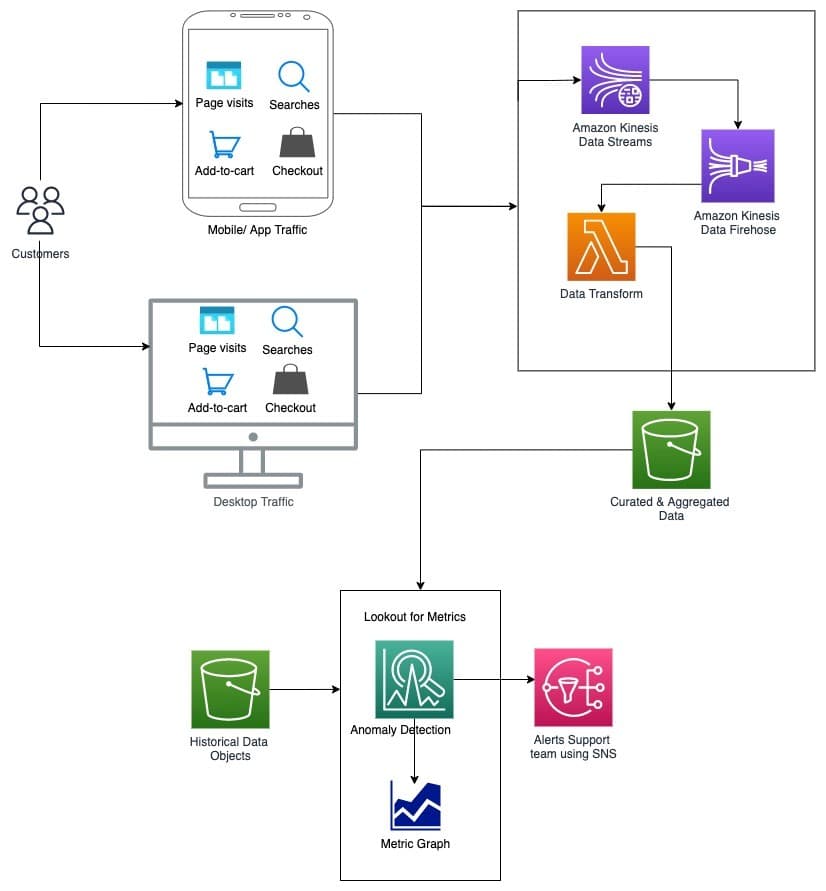
Design a real-time anomaly detection system for 'add to cart' events
Tests real-time data pipeline design and nuanced anomaly detection. A good answer outlines ingestion (Kinesis), processing (Lambda/Flink), seasonal modeling for 'a drop', and alerting (SNS).
How would you measure P95 latency by geographic region?
Tests your ability to design a practical metrics pipeline, considering instrumentation, data types (metrics vs. logs), and aggregation. Instrument the API with a histogram metric and a `region` label, then query using `histogram_quantile`.
How would you capture and persist UTM parameters for attribution?
Tests your grasp of state management and data persistence for analytics. A good answer covers capturing UTMs with JS, persisting them in a cookie, and associating them with a user record on the server during a conversion event.
Describe the client-side event for an 'Add to Cart' button
This tests your ability to design analytics events for future analysis. Name a standard event like `add_to_cart` and list item parameters (`item_id`, `price`, `quantity`).
Describe two methods for generating prediction intervals
This tests your understanding of forecast uncertainty. Describe two methods: 1) assuming normally distributed errors and using a standard deviation multiplier, and 2) bootstrapping residuals to simulate future paths.
How do you handle model performance degradation over time?
This tests MLOps lifecycle awareness. Name concept drift, outline a systematic diagnosis of data and error patterns, discuss retraining strategies, and propose a monitoring plan. A red flag is just saying 'retrain the model' without any diagnosis.

Forecasting inventory with trend and weekly seasonality?
This tests mapping a business problem to a statistical tool. A good answer names Holt-Winters, explains its level, trend, and seasonal components, and discusses additive vs. multiplicative seasonality.
Train-test split vs. time-series cross-validation?
Tests if you see why temporal data breaks random splits. Contrast random sampling with sequential 'walk-forward' validation, where you only use past data to predict the future.
Explain stationarity in a time series
This tests your grasp of core time series modeling assumptions. A strong answer defines stationarity (constant mean/variance), explains its importance for ARIMA (stable patterns), and names a test (ADF) and a fix (differencing).
How would you measure a sales forecast model's accuracy?
This tests your ability to connect statistical metrics to business impact. A great answer defines MAE (linear error cost) and RMSE (penalizes large errors), explains the choice depends on business context, and stresses using a test set.
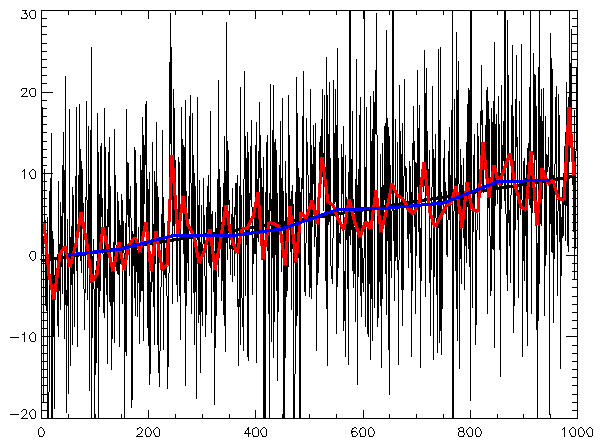
Describe EDA for a 3-year daily user sign-up dataset.
Tests your structured approach to time series EDA. A good answer identifies trend, seasonality, and anomalies before modeling. A red flag is jumping to forecasting models or only mentioning the overall average growth, ignoring cyclical patterns.

How does CUPED increase the statistical power of an experiment?
Tests your grasp of variance reduction. Explain CUPED as ANCOVA, using pre-experiment data (X) to remove predictable noise from the outcome (Y). Effectiveness depends on correlation (rho), reducing variance by (1-rho^2).
Handling spillover effects in social network A/B tests
This tests your grasp of SUTVA violations in networked experiments. A great answer explains how user-level randomization causes spillover, then proposes graph cluster randomization to assign entire communities to treatment or control, minimizing…

Primary vs. Guardrail Metrics in Experiments
This tests if you can balance improving a key metric with not harming the user experience. Define primary (the goal) and guardrail (don't harm) metrics. Give an example where a guardrail regression (e.g., latency) blocks a feature ship.
Handling the novelty effect in experimentation
This tests your grasp of second-order effects in A/B testing. A great answer defines the novelty effect, explains how it inflates initial metrics, and suggests mitigating it by running tests longer or segmenting by user tenure. A red flag is ignoring it.
Why is stopping an A/B test when it hits significance problematic?
Tests your understanding of the 'peeking problem' in A/B testing. A great answer defines peeking, explains how it inflates the Type I error rate (false positives), and states the need for a predetermined sample size.
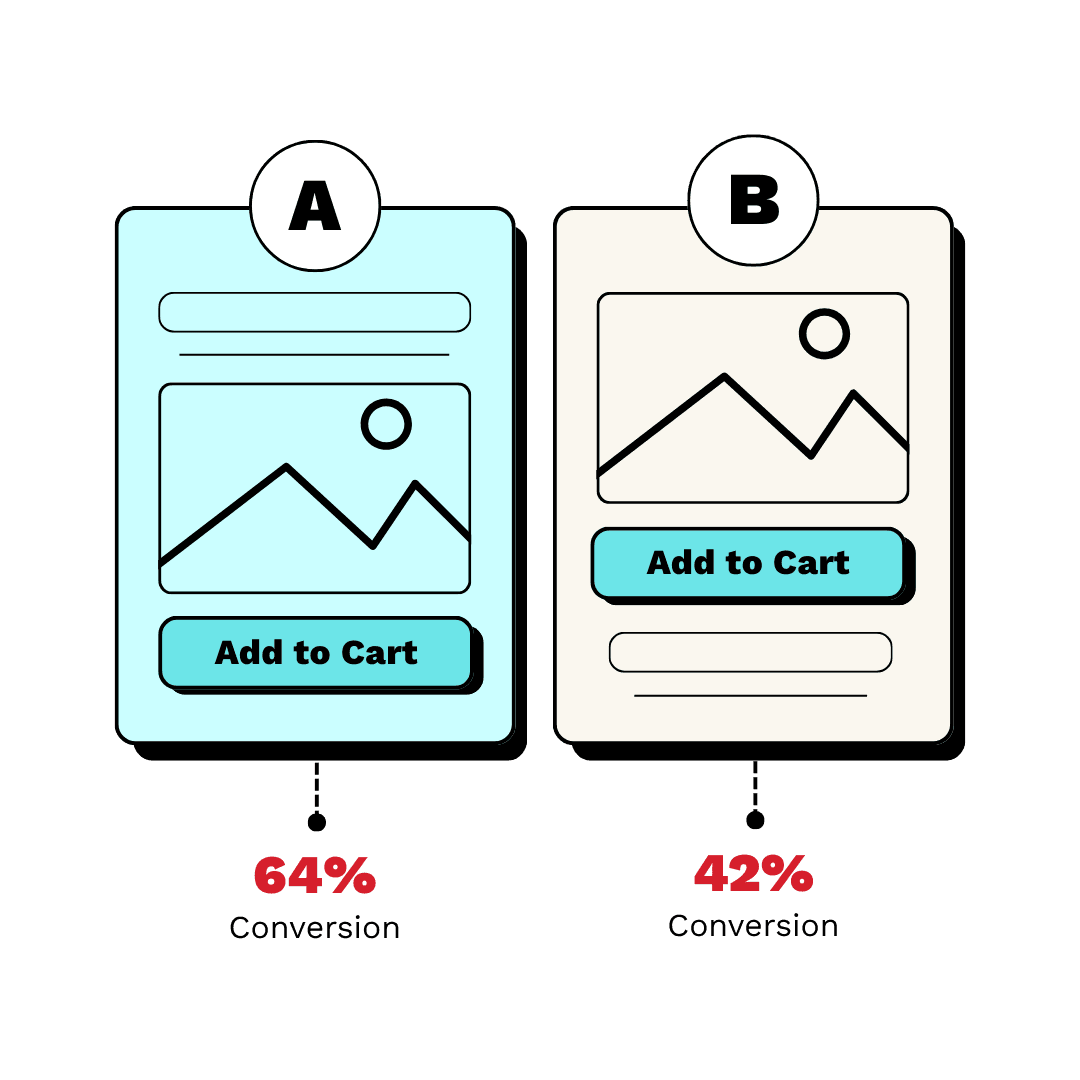
How do you determine A/B test sample size and duration?
This tests your ability to connect business goals to statistical parameters. A good answer defines the four power analysis inputs (baseline, MDE, alpha, power) and explains trade-offs, then converts sample size to duration using business cycles.
How would you A/B test a 'Buy Now' button color change?
This tests structured thinking. A good answer defines a hypothesis, selects primary and guardrail metrics, and outlines the experiment's duration and analysis plan. A red flag is focusing only on clicks without considering business impact.