Everything in Analytics & Metrics, page 14
How do you handle timezones for a daily global sales report?
This tests your understanding of time data modeling and business requirements. A good answer stores events in UTC with a timezone identifier, then converts to the business's chosen 'day' at query time. A red flag is storing local time without context.
How would you implement Change Data Capture (CDC)?
Tests your grasp of data replication trade-offs. A great answer compares log-based CDC (low impact, complete) with query-based methods (higher impact, misses deletes), and recommends log-based CDC for its minimal production impact.

Propose a multi-touch attribution model and its data pipeline
Tests your grasp of attribution models and their data engineering needs. Propose a rule-based model (e.g., time-decay), outline the data pipeline for it, and acknowledge privacy-driven signal loss. A red flag is ignoring the challenge of identity resolution.
Transform a time series for a supervised learning model?
This tests your ability to reframe a time series problem for tabular models. A great answer explains creating features from lags, rolling windows, and calendar data, then emphasizes using a time-aware validation split. A red flag is forgetting validation.

Find leading indicators for long-term churn
This tests your ability to translate a business problem into a data investigation. A strong answer defines churned vs. retained cohorts, hypothesizes key early behaviors, and compares their frequency to find a leading indicator.
Calculate Daily Active Users (DAU) with SQL
This tests product sense and SQL fundamentals. Define 'active' with a core product action, describe the event data needed, then write a COUNT(DISTINCT user_id) query. A red flag is writing SQL before defining the business logic for 'active'.
Client-Side vs. Server-Side Event Tracking
Tests your grasp of data integrity and architectural trade-offs. A great answer defines both, favors server-side for reliability (avoids ad-blockers), but notes client-side's richness for UI events. A red flag is presenting them as equal choices.

How would you build a SQL query for a conversion funnel?
Tests your ability to translate a business need into a technical SQL solution. A good answer uses CTEs or LEFT JOINs to model sequential steps, counts users at each stage, and discusses attribution.
Trade-offs: Bundled vs. Warehouse-Native Product Analytics
This tests your grasp of modern data stack architecture. A great answer weighs trade-offs in data control, cost, query flexibility, and team capabilities. A red flag is ignoring total cost of ownership and engineering overhead for a warehouse-native setup.
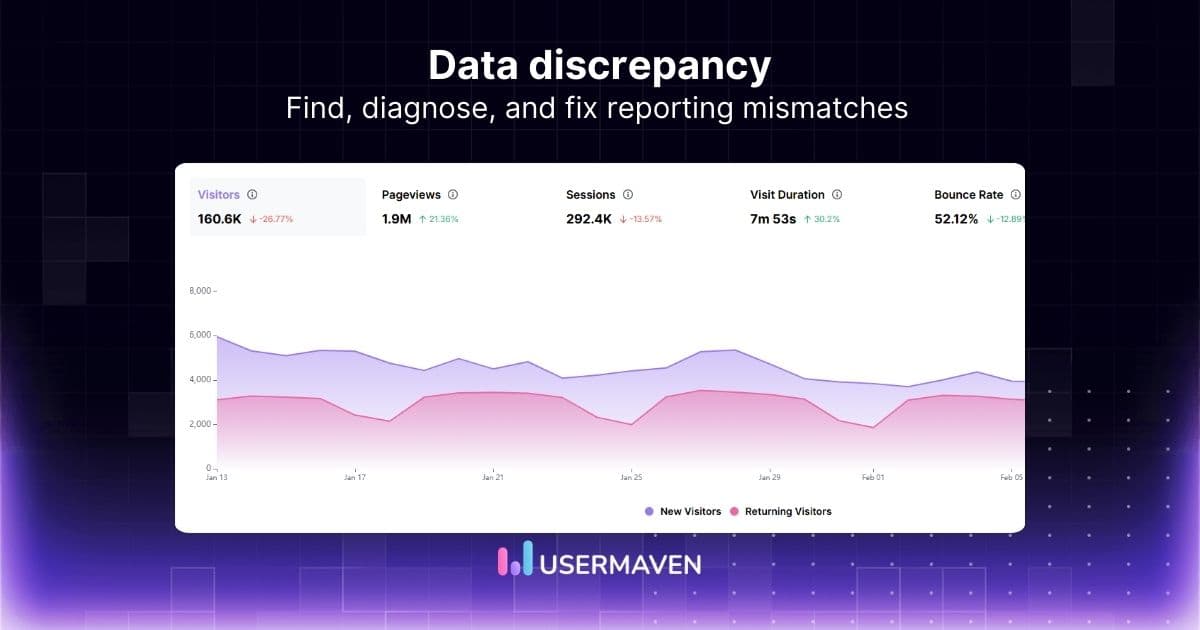
Why don't analytics and backend user counts match?
This tests your systematic debugging and understanding that 'user' has different definitions. A good answer first defines 'user' in each system, then investigates tracking implementation, timing differences, and filtering.
Client-side vs. Server-side Event Tracking: When and Why?
This tests your grasp of data reliability and security trade-offs. A good answer defines both, contrasts reliability (ad blockers) vs. implementation ease, and uses a critical event like "Payment Processed" to justify server-side's accuracy.
Architect a Multi-Touch Attribution System
This tests your grasp of modern data challenges like signal loss. A good answer discusses data ingestion, identity resolution, and model trade-offs. A red flag is focusing only on the algorithm and ignoring the data pipeline's fragility.
Calculate a 3-step user onboarding funnel with SQL
Tests your ability to translate a business need into a robust data query. A great answer clarifies funnel logic (attribution, timing), defines the user cohort, finds each user's first event for each step, and then calculates conversion.

Implement an A/B test for a new checkout flow
This tests your ability to design a robust, stateful system for experimentation and data analysis. A great answer details user bucketing, consistent variant assignment across devices, and the SQL query structure for analysis.

What is the 'multiple comparisons problem' in A/B testing?
Tests your grasp of statistical pitfalls in large-scale A/B testing. Define the problem (inflated false positives), explain the business risk (wasted effort), and propose a mitigation like Bonferroni correction.

Visualizing Load Time vs. Session Duration with a Third Variable
Tests your ability to visualize correlation and add dimensions. A great answer suggests a scatter plot for the initial relationship, then uses color to segment by the categorical third variable (network type).
.png&w=1600&q=75)
Cohort Analysis for a New Onboarding Flow
Tests applying analytics to measure impact. Define a cohort, then compare a pre-launch (Dec) vs. post-launch (Jan) acquisition cohort, tracking retention over time. A red flag is using aggregate metrics, which hide the true impact of the change.

How would you visualize a complex, multi-stage user funnel?
Tests product sense and data viz literacy. A good answer proposes a Sankey/Alluvial diagram to show non-linear flows, explains how it visualizes drop-off and re-entry, and notes the data needs. A red flag is just suggesting a better standard funnel chart.
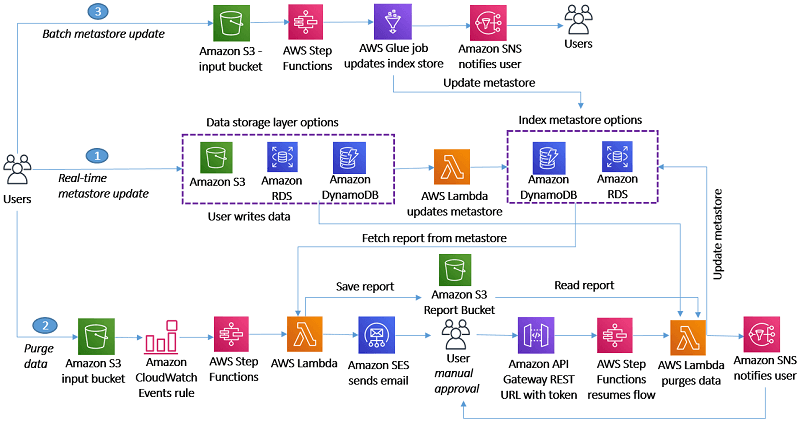
Design a GDPR 'Right to be Forgotten' System
Tests your ability to design a verifiable data deletion system. A good answer outlines an index metastore, an orchestrated workflow, and auditing. A red flag is focusing only on the primary database, ignoring the data lake, warehouse, and caches.
Design an analytics event payload for a button click
This tests your data modeling for analytics. A good answer includes the event name, user ID, and timestamp, then adds contextual and user properties. A red flag is forgetting the user ID or suggesting dynamic property names, which breaks segmentation.
We are hiring for this. Every open role lists the topics its interview covers, so you can prepare for the real thing rather than guessing.
See open roles