More in Analytics & Metrics — page 15

Describe AARRR and apply it to B2B vs. B2C analytics
Tests applying the AARRR framework to different business models. Define AARRR, then apply to B2B SaaS (account-level activation) vs. a B2C game (user-level virality). Red flag: using generic metrics that ignore the context of B2B sales vs. B2C usage.
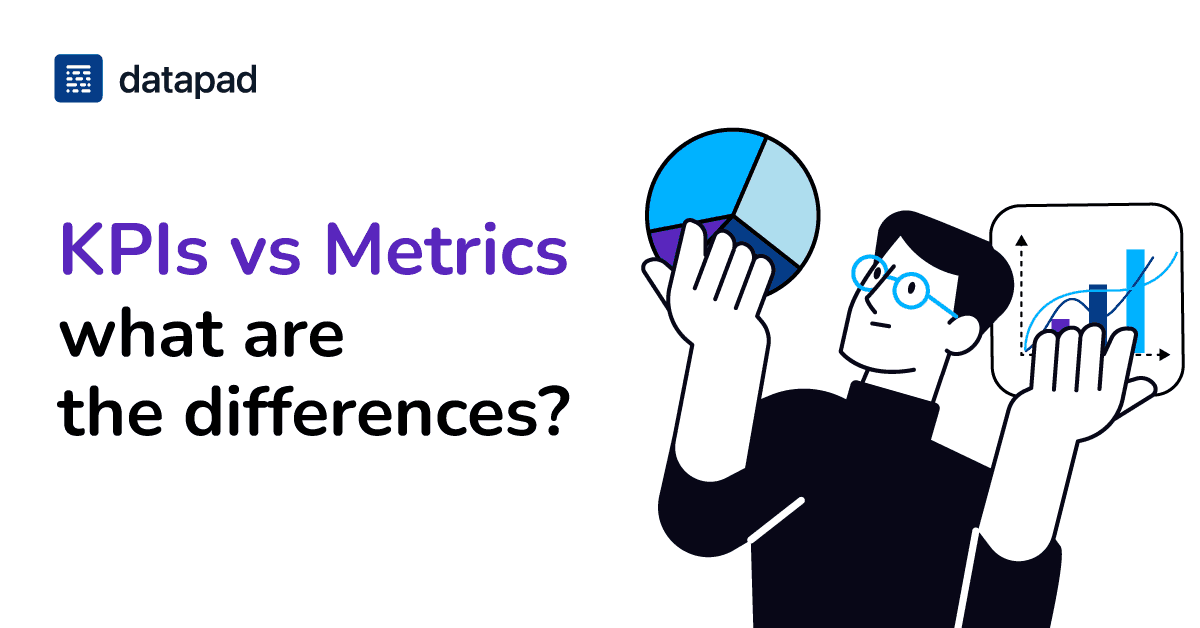
What's the difference between a metric and a KPI?
This tests your ability to connect technical measurements to strategic business outcomes. A great answer defines both, notes KPIs are a subset of metrics tied to goals, and gives a concrete example like page views (metric) vs. conversion rate (KPI).
Design a Column-Level Data Lineage System at Scale
This tests your ability to design for metadata at scale. A great answer outlines automated collection (parsing/instrumentation), storage in a graph database, and APIs for impact analysis.

Investigate a 20% drop in a key revenue metric
This tests your ability to lead a high-pressure investigation. A great answer confirms the drop, traces data from dashboard to source, and differentiates bugs from business trends. A red flag is jumping to conclusions without a systematic, layered approach.
Design a self-service analytics platform for non-technical users
Tests your ability to design a layered system for non-technical users. A great answer outlines a semantic layer for data modeling, a no-code UI for exploration, and a query generation engine.

Describe the architecture of an A/B testing framework
This tests your system design skills for experimentation, from user bucketing to statistical analysis. A good answer covers user assignment, a config service, a data pipeline, and a results layer with statistical significance.
Design a Data Quality Monitoring & Alerting System
This tests translating business needs into a concrete data validation strategy. A good answer defines checks based on business impact (freshness, volume, schema), then outlines a tiered alerting system. A red flag is naming tools before defining the problem.

Design a Centralized Metrics Layer
This tests your grasp of data governance and creating a single source of truth. A good answer defines a semantic layer between the data warehouse and BI tools, centralizing metric definitions in code.
Instrumenting a New User Interaction for Analytics
Tests your grasp of the full data lifecycle. A good answer covers event definition, client-side implementation, the backend pipeline, and end-to-end verification.
How would you build a weekly active user dashboard?
This tests your ability to translate a business request into a technical plan. A good answer defines "active," identifies necessary data (user ID, timestamp, event), outlines the data modeling, and explains the BI tool implementation.
How do you measure impact while accounting for the novelty effect?
Tests your ability to design experiments that isolate long-term effects. A good answer proposes a long-running A/B test, analyzing user cohorts by join date to see if initial lift decays. A red flag is ignoring the novelty effect and suggesting a short test.
Design a Real-Time Analytics Pipeline for Mobile Events
Tests your grasp of low-latency, high-throughput design. A strong answer outlines ingestion (Kafka), stream processing (Flink), and a real-time OLAP database (Druid/ClickHouse). A red flag is proposing a slow, batch-only architecture.

Design a data warehouse model for tracking feature adoption
This tests your grasp of data warehousing star schemas for efficient behavioral analysis. A strong answer proposes a central `events` fact table linked to `users`, `features`, and `time` dimension tables.

Explain cohort analysis for user retention and write a pseudo-query
Tests your ability to use precise metrics. A good answer defines a cohort, explains why it isolates variables better than aggregate data, outlines the calculation, and provides a clear pseudo-query.

Track an 'Export to CSV' button's usage and outcomes
This tests your ability to design a robust event schema, not just track a click. A great answer uses one custom event name with a 'status' parameter ('initiated', 'success', 'failure'). A red flag is suggesting multiple event names for one action.
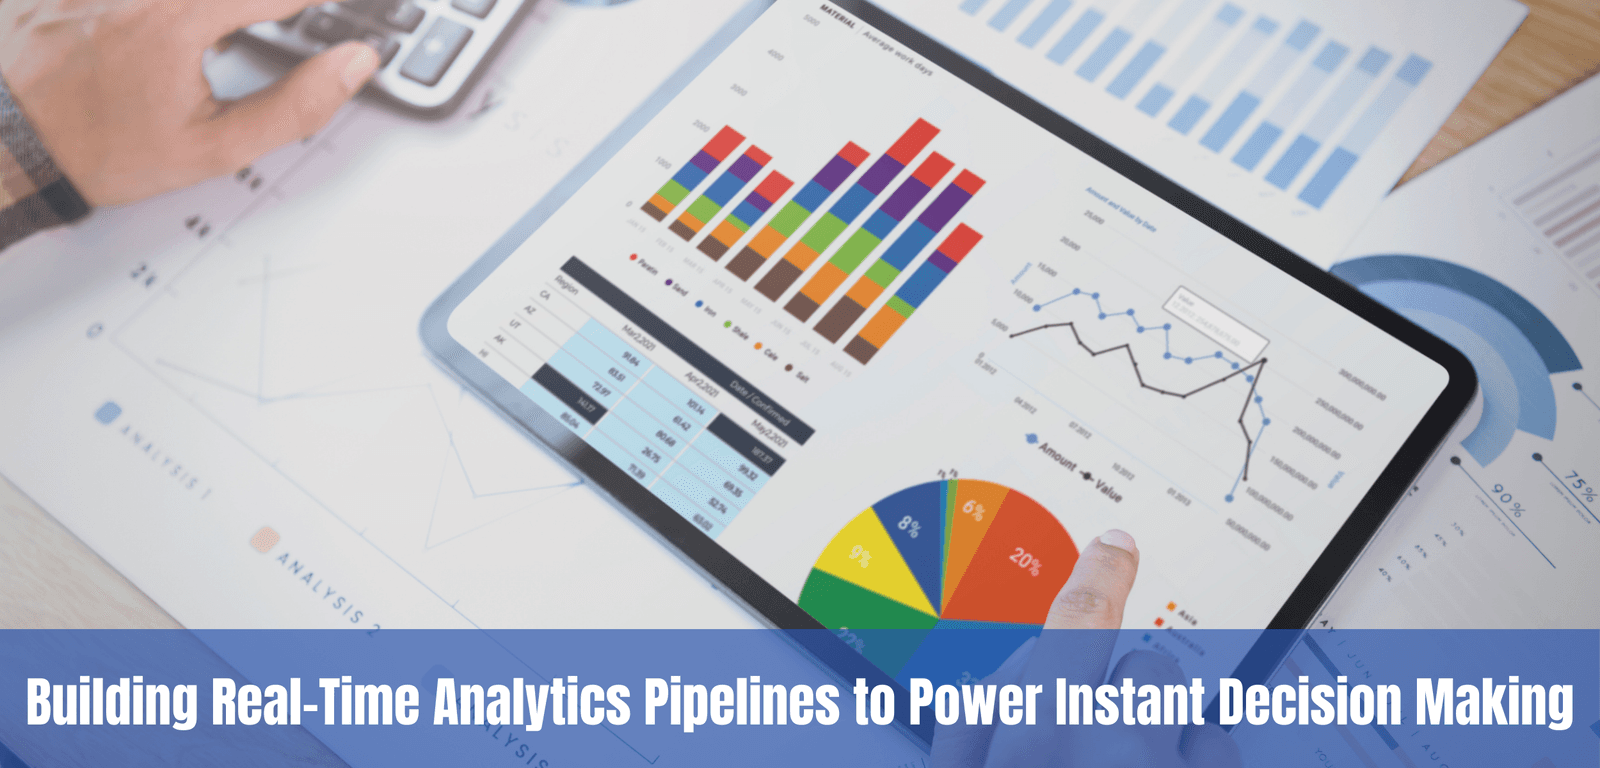
Design a near real-time analytics pipeline for a critical metric
This tests your grasp of stream processing trade-offs (latency, cost, correctness). Outline a 4-stage pipeline (ingest, process, store, visualize) with specific tech choices, contrasting its low-latency, high-cost nature with batch.
How would you optimize a slow, expensive data warehouse?
Tests your diagnostic approach to performance issues. A good answer first analyzes query patterns, then applies partitioning by date, clustering by high-cardinality keys, and materialized views for aggregations.
Explain event schemas and the purpose of a schema registry
This tests your grasp of data governance in event-driven systems. A good answer defines a schema as a contract, a registry as the enforcer, and then details specific downstream failures like broken pipelines and bad analytics. A red flag is being too vague.
How would you design a data model for a feature adoption dashboard?
Tests applying dimensional modeling to a business need. A good answer defines a central fact table (e.g., `feature_usage`) and related dimensions (`user`, `feature`, `date`). A red flag is designing a transactional model or being too vague about the schema.

Describe dbt's role in a modern analytics stack
Tests your grasp of the ELT paradigm and applying software engineering principles to data. A good answer defines dbt as the 'T' in ELT, contrasts its in-warehouse SQL approach with traditional ETL, and clarifies its relationship with orchestrators like…