More in Analytics & Metrics — page 26
Benchmarking: Know Where You Stand in Your Industry
Benchmarking answers "Are we good?" by comparing your performance metrics against industry bests. It's used to set realistic goals for cost, quality, or time. The main footgun is comparing apples to oranges—using benchmarks from dissimilar companies.

Data Visualization: Turning Numbers into Insight
Data visualization turns raw data into pictures, revealing stories that numbers alone can't tell. It's used to spot trends, find outliers, and grasp complex relationships in datasets.

Ad Hoc Reporting: Answering One-Off Business Questions
Ad hoc reporting is your data "quick dive" for one-off questions, unlike static dashboards. A sales team might use it to see how a holiday affected regional sales.
Cross-Tabulation: Finding Relationships in Your Data
Cross-tabulation reveals how two variables are related by counting their joint occurrences in a grid. It's key for survey analysis or A/B testing. The footgun is assuming correlation implies causation; the table shows a relationship, not its cause.
Drill-Down Analysis: From Summary to Specifics
Drill-down analysis moves from a high-level data summary to the granular details composing it. It's used in dashboards to investigate a metric's change, like clicking a monthly sales dip to see daily figures.
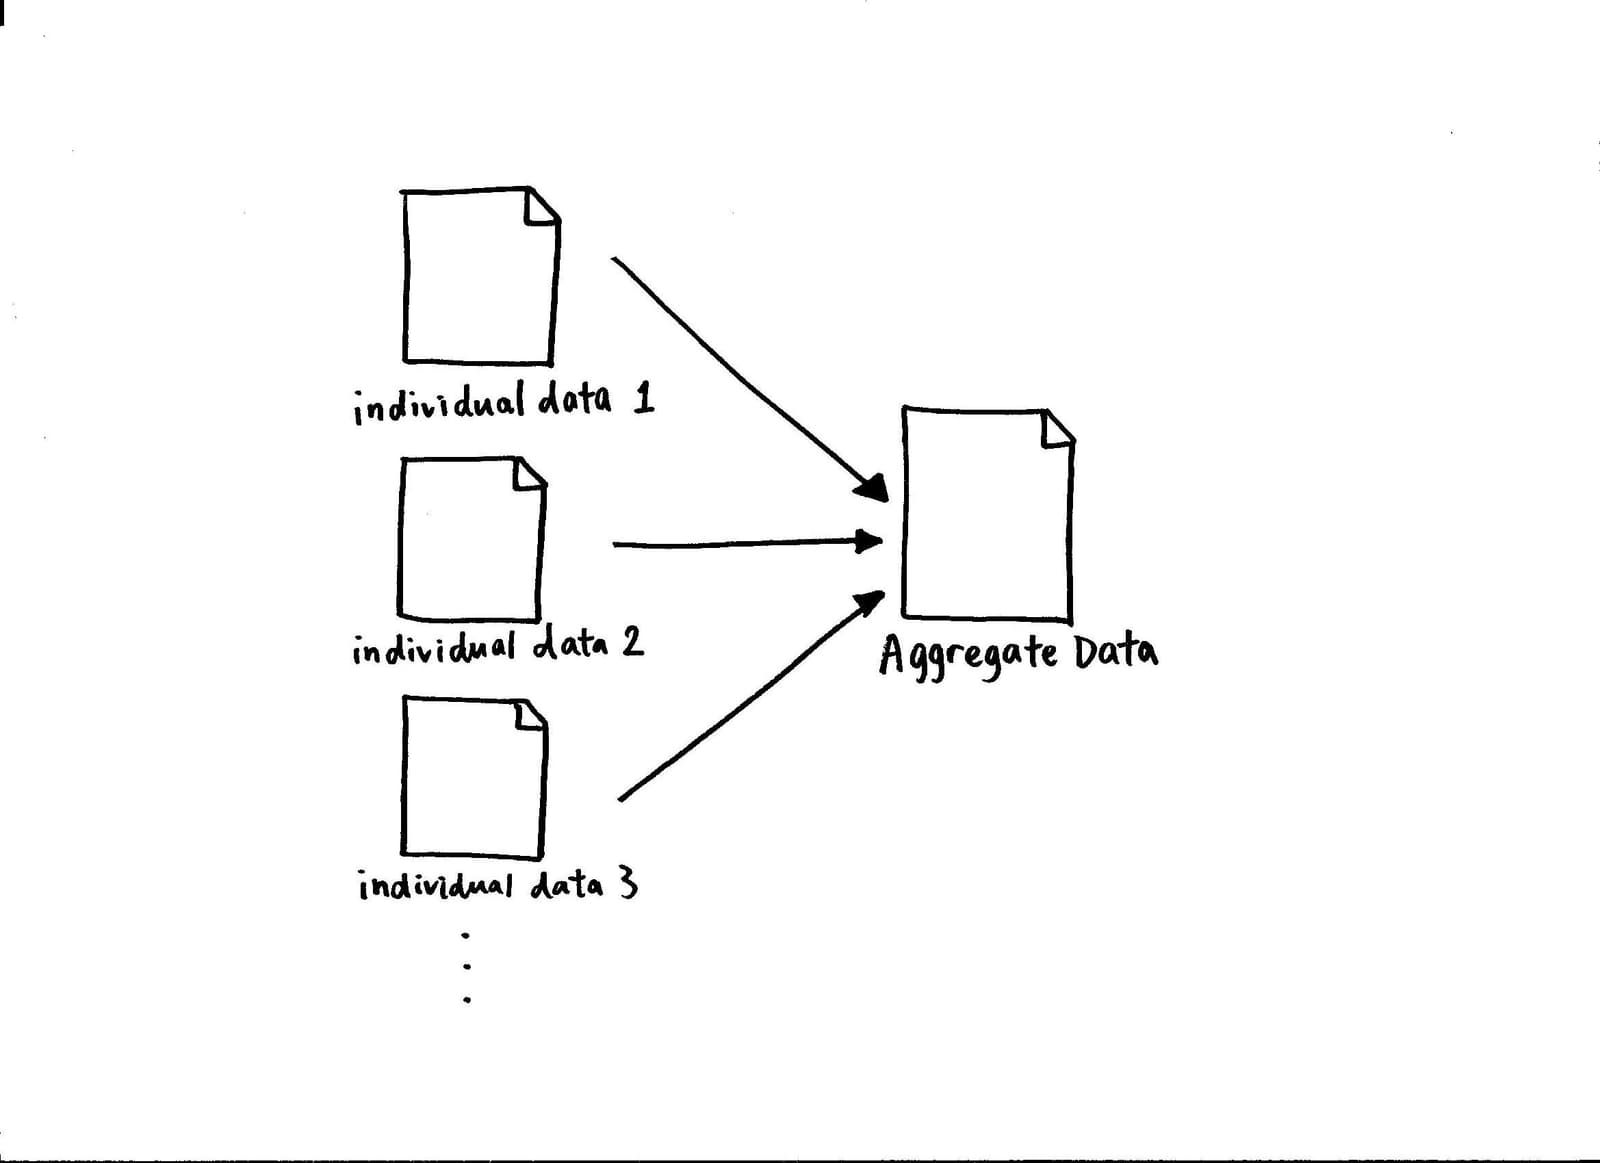
Data Aggregation: The Big Picture from Small Details
Data aggregation rolls up granular records into high-level summaries, like turning individual sales logs into a daily sales report. It's used to power dashboards and speed up warehouse queries.
Business Intelligence (BI) Tools: From Raw Data to Dashboards
BI tools turn raw company data into visual dashboards and reports. They let non-technical teams explore sales trends or user behavior from a data warehouse, but remember: a slick dashboard built on messy data is just a pretty lie.
Descriptive Statistics: What Your Data Looks Like
Descriptive statistics summarize the data you have, painting a picture of your sample without making guesses about the wider world. It's used for calculating things like average age or max response time.
Report Generation: Turning Raw Data into Human-Readable Documents
Report generators translate raw data into formatted documents for human eyes. They power business dashboards and sales summaries. The main footgun is forgetting the report is a stale snapshot, not the live data source itself.
Data Masking: Protect Data, Preserve Utility
Data masking creates a realistic but fake version of your data by scrambling sensitive fields. It's used to give developers and analysts safe datasets for testing or analytics without exposing real PII.
Data Stewardship: The Librarian for Your Data
A data steward is the designated owner of a data asset, responsible for its quality and business value, not just its storage. This role is crucial where data is shared across teams, ensuring consistency.
Master Data Management (MDM): The Single Source of Truth
Master Data Management (MDM) creates a single source of truth for core business entities. It's used when departments have conflicting data (e.g., 'ACME Inc.' vs 'Acme Corp').
Data Governance: Corporate Management vs. Global Policy
Data governance operates at two scales: managing data within a company and setting data policy between nations. It applies to corporate data management and international internet governance.

GDPR: Treating User Data as a Liability, Not an Asset
GDPR treats personal data as a liability borrowed from the user. It gives EU citizens strong rights over their data, like access and erasure, forcing any company processing it to comply. The footgun is assuming it doesn't apply if your company isn't in the EU.
Data Anonymization: Protecting Privacy by Removing PII
Data anonymization breaks the link between data and real people by removing personal identifiers. It’s used to share datasets for research or analytics while protecting privacy.
Data Catalog: The Library Card for Your Data
A data catalog is like a library card catalog for your company's data, telling you what exists, where it lives, and what it means. It helps analysts find trustworthy datasets and engineers trace the impact of schema changes. The footgun is letting it go stale.
Data Lineage: The Story of Your Data
Data lineage is a family tree for your data, showing its origins, transformations, and final destination. It's essential for debugging broken analytics and tracing errors to their source.
Data Quality: Is Your Data Fit for Purpose?
High-quality data is defined by its fitness for a specific purpose, not just its correctness. It must accurately represent the real world. This is critical for business planning or ML models.
Data Profiling: The First Step in Any Data Project
Data profiling creates a 'character sketch' of a dataset, revealing its structure, content, and quality. It's the first step in data warehousing or analytics to discover metadata and assess risks. The footgun is skipping it, leading to late-project surprises.
Data Validation: Garbage In, Garbage Out
Data validation is the bouncer for your app, checking data at the door to ensure it's correct and useful. It's used on user forms, API requests, and file imports. The footgun is skipping it, which risks corrupted data, security holes, and future crashes.