Intermediate concepts in Product Management, page 2

Fogg Behavior Model: Why Users Act (or Don't)
The Fogg Behavior Model states a behavior only happens when Motivation, Ability, and a Prompt converge (B=MAP). Use it to diagnose why a feature fails or to design new ones. The footgun is blaming low motivation when the real issue is low ability.
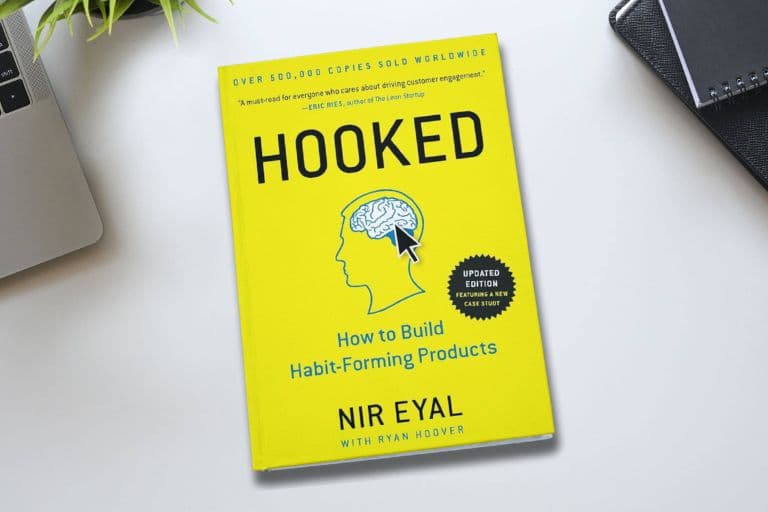
The Hook Model: Designing for Repeat Engagement
The Hook Model engineers user habits with a 4-step loop: Trigger, Action, Variable Reward, and Investment. It's a framework for building products people return to on their own, common in social media and games.
Anchoring Bias: The First Number You See Matters Most
The first number you see acts like a mental anchor, warping all subsequent judgments. This is used in pricing, where a high "original" price makes a sale price seem better, and in negotiations.
Contextual Inquiry: Watch Users in Their Habitat
Go to the user's environment to see what they *actually* do, not just what they say they do. It's used in early discovery to uncover unstated needs by observing real workflows. The footgun is 'helping' the user, which pollutes the observation.
The Peak-End Rule: Design for Memory, Not Averages
Users don't remember the average of an experience; they remember its most intense moment and its end. This shapes recall of onboarding, support calls, or checkout. The footgun is optimizing for overall 'goodness' while ignoring a painful peak or weak ending.
Diary Study: Capturing User Behavior Over Time
A diary study captures user habits by having them log experiences over time. It's used to understand routines or decision-making in a user's natural environment, without the high cost of a field study. The footgun is relying on self-reported data.
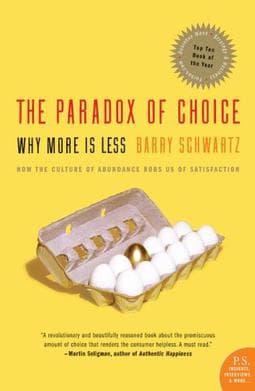
The Paradox of Choice: Why More Options Can Hurt
The Paradox of Choice argues that more options can decrease user satisfaction. Instead of empowering users, an explosion of choices in pricing tiers or feature settings can lead to decision paralysis. The footgun is assuming users want maximum choice.

Generative vs. Evaluative Research: Define Problems vs. Judge Solutions
Generative research defines problems by asking, "What should we build?" Evaluative research judges solutions by asking, "Did we build it right?" The footgun is using evaluative methods for discovery, which just optimizes a solution for a problem nobody has.
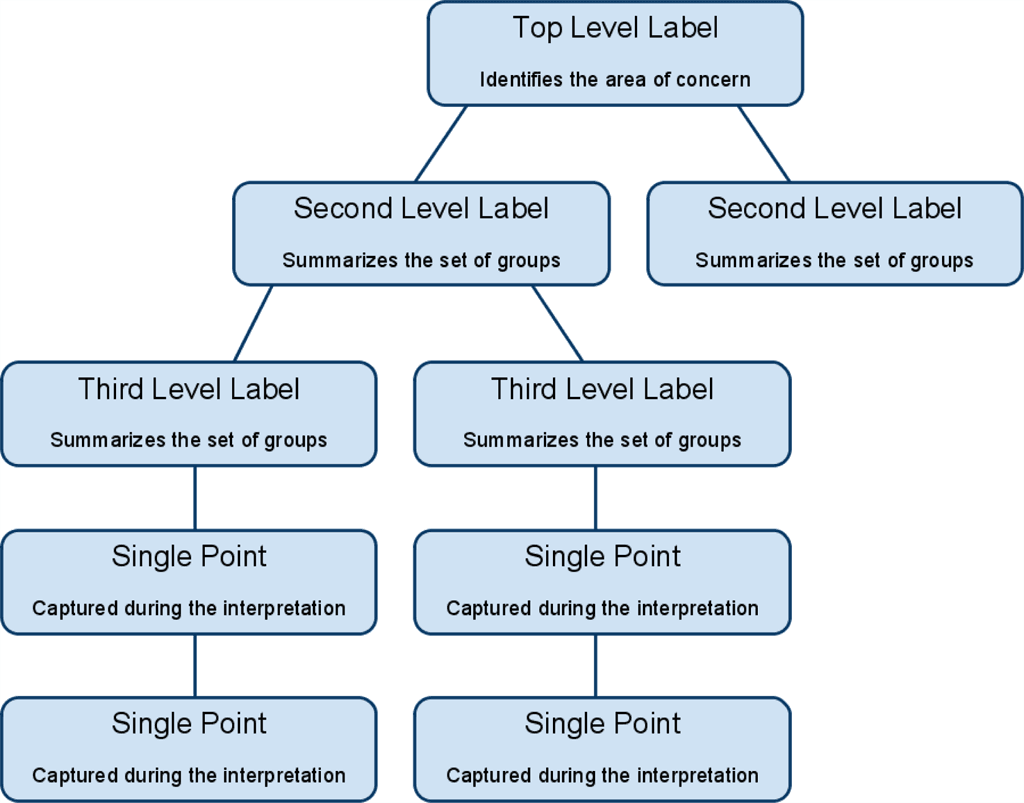
Affinity Diagramming: Finding Structure in Chaos
Affinity diagramming turns a pile of raw ideas into organized themes by grouping them based on natural relationships. Use it after brainstorming to find patterns. The biggest mistake is debating ideas instead of focusing on the connections between them.

Focus Groups: Understanding the 'Why' Behind User Reactions
A focus group is a guided conversation to uncover the 'why' behind user opinions, not just what they are. It's used to gauge reactions to new products or understand shared experiences.
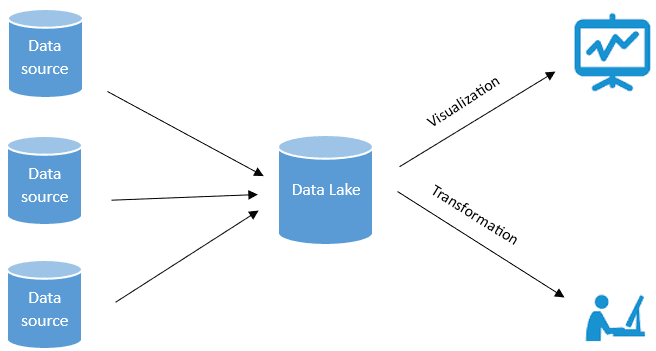
Data Lake: Store Raw Data Now, Analyze It Later
A data lake is a central repository that holds vast amounts of raw data in its native format. This "store now, structure later" approach is ideal for machine learning on original, unfiltered source data.

Data Marts: Your Department's Slice of the Data Warehouse
Think of a data mart as a department's personal slice of the main data warehouse, containing only relevant data. This allows teams like Sales or Marketing to run faster, focused queries. The footgun is letting each team define shared terms differently.
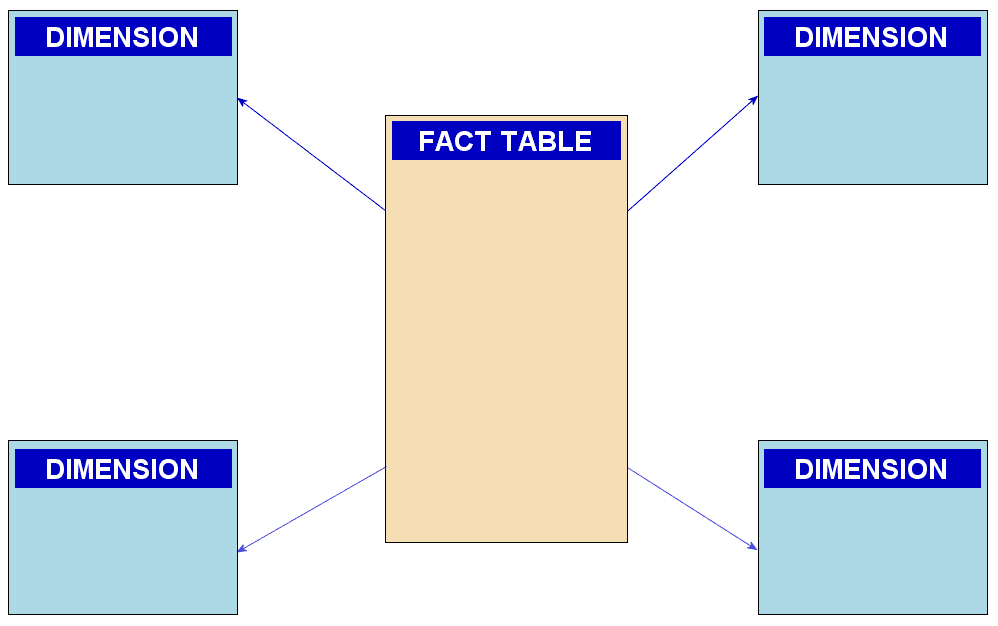
Star Schema: The Blueprint for Analytics Data
A star schema organizes analytics data with a central fact table (e.g., sales) surrounded by dimension tables (e.g., customers). It's built for fast queries in data warehouses. The footgun is normalizing dimensions, which negates its speed advantage.
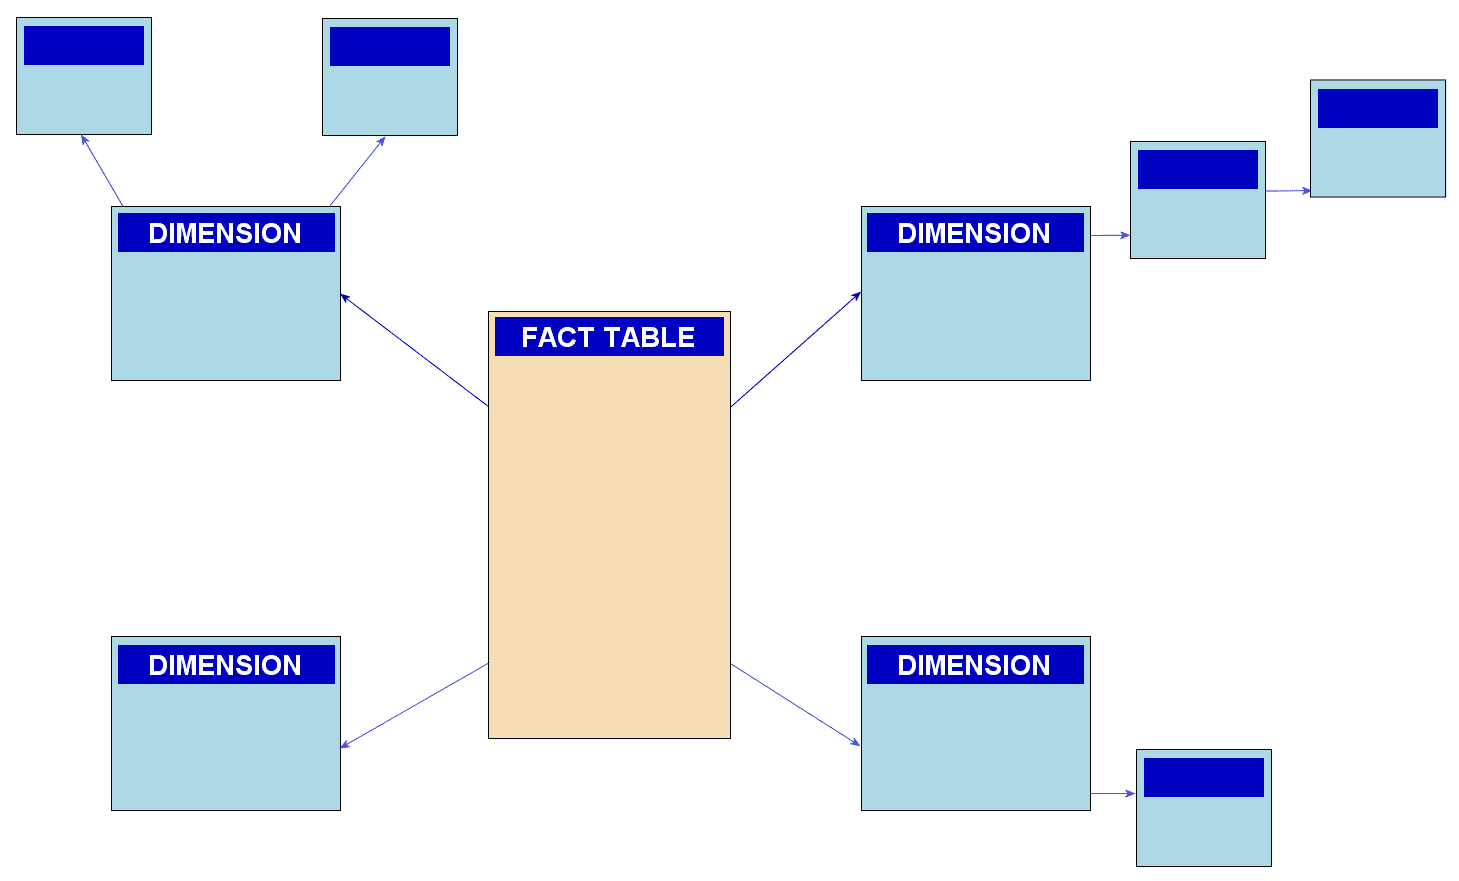
Snowflake Schema: Trading Query Speed for Storage
A snowflake schema saves storage by normalizing a star schema's dimensions into smaller, related tables. It's used in data warehouses to reduce redundancy, but the extra joins required can slow down queries, making it a trade-off against a simpler star schema.

The MoSCoW Method: Prioritizing for Fixed Deadlines
The MoSCoW method protects deadlines by sorting work into four buckets: Must Have, Should Have, Could Have, and Won't Have this time. It's used in agile projects with fixed timelines to ensure critical features ship.

The RICE Scoring Model: Prioritize with Data, Not Feelings
RICE is a formula—(Reach × Impact × Confidence) / Effort—for scoring competing features. It replaces gut feelings with a data-driven framework for prioritizing product roadmaps. The biggest footgun is treating the score as gospel, not a conversation starter.
Change Data Capture (CDC): Turn Your Database Into a Stream
Change Data Capture (CDC) turns your database into a real-time stream of change events (inserts, updates, deletes). It's used to sync data across systems, like updating search indexes or feeding analytics warehouses, without full table scans.
User Story Mapping: From Backlog to Value Map
User Story Mapping reframes your backlog from a feature list into a map of the user's journey, focusing on delivering outcomes customers value. It helps teams prioritize work by visualizing the whole experience.
Stakeholder Mapping: Prioritizing Voices by Power and Interest
Stakeholder mapping visualizes who to engage by plotting their power and interest in your project. Use it to decide who needs daily updates versus a quarterly summary. The footgun is treating it as static; a stakeholder's influence can change overnight.
Competitive Intelligence: Turning Market Data into Strategy
Competitive intelligence turns public data about your market into a strategic map of what might happen next. It's used when pricing products or planning campaigns. The biggest mistake is confusing it with simple competitor tracking; true CI analyzes the *why*.
We are hiring for this. Every open role lists the topics its interview covers, so you can prepare for the real thing rather than guessing.
See open roles