Concepts in Product Management, page 10
Lookalike Audiences: Find More of Your Best Customers
Lookalike audiences find new customers by algorithmically modeling your best existing ones. Ad platforms like Facebook use your "seed" list of high-value users to find a much larger group of statistically similar people to target with ads.
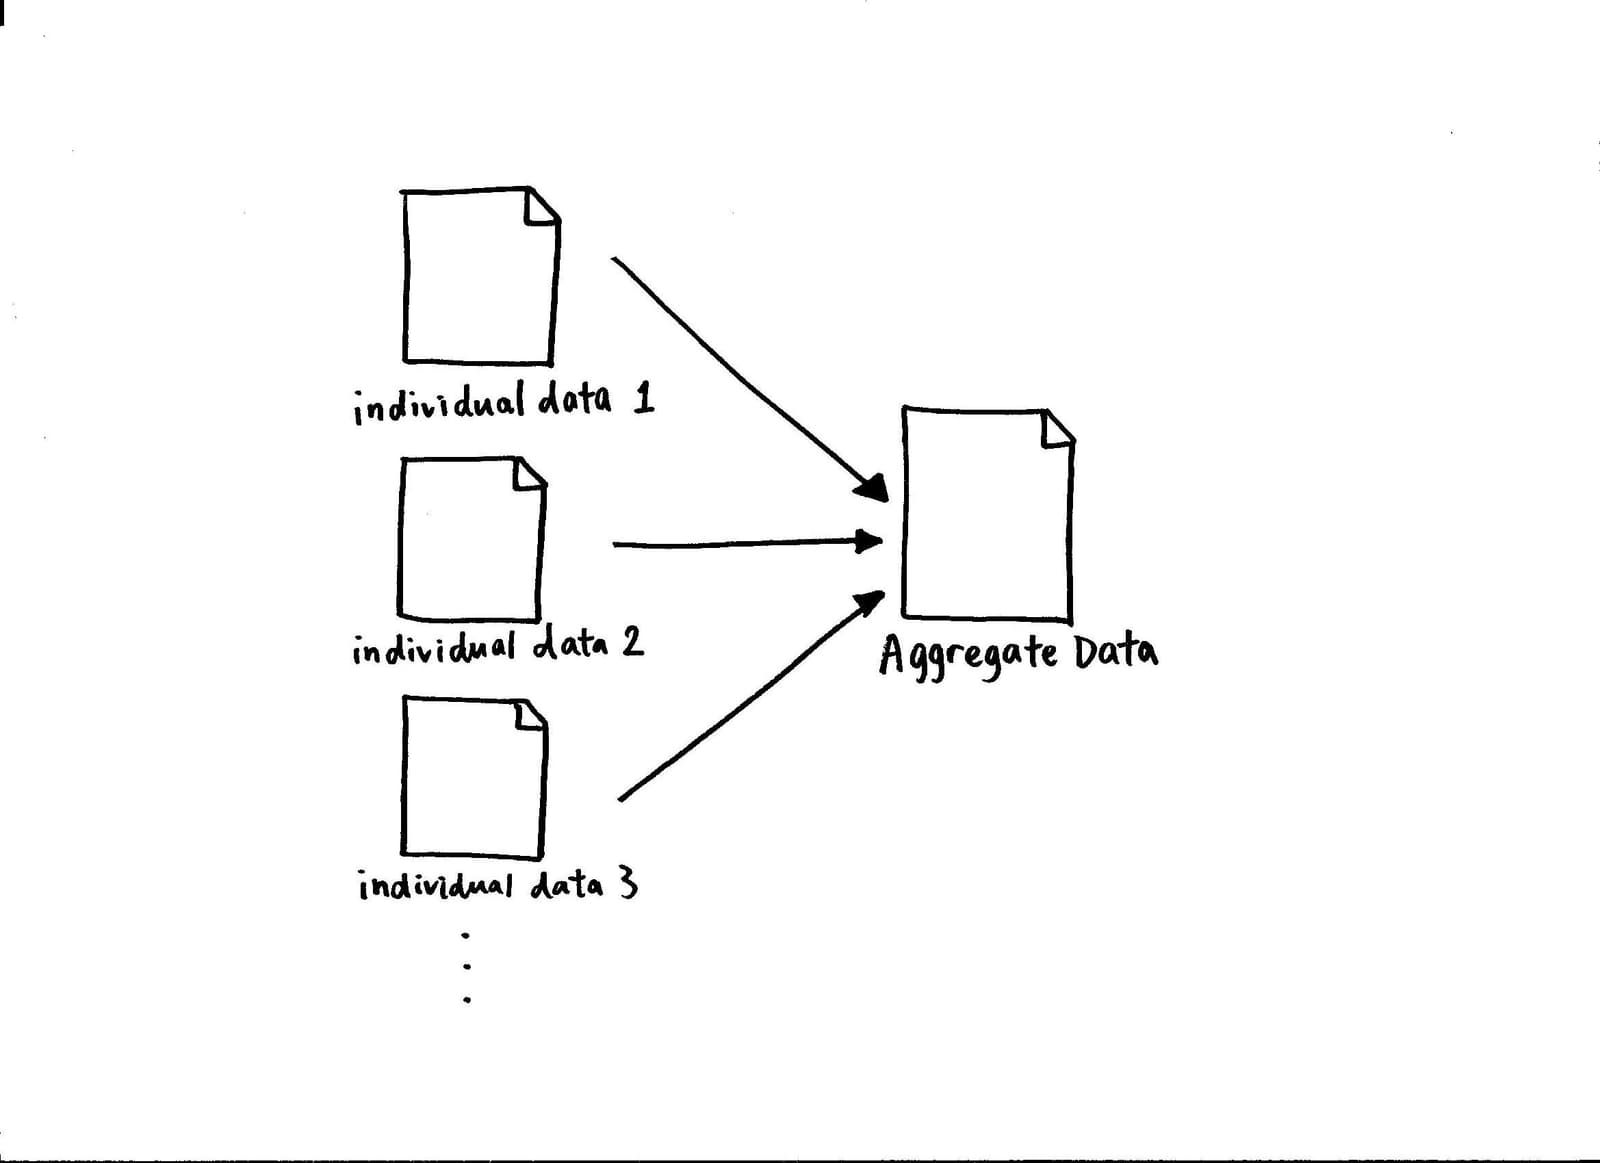
Data Aggregation: The Big Picture from Small Details
Data aggregation rolls up granular records into high-level summaries, like turning individual sales logs into a daily sales report. It's used to power dashboards and speed up warehouse queries.
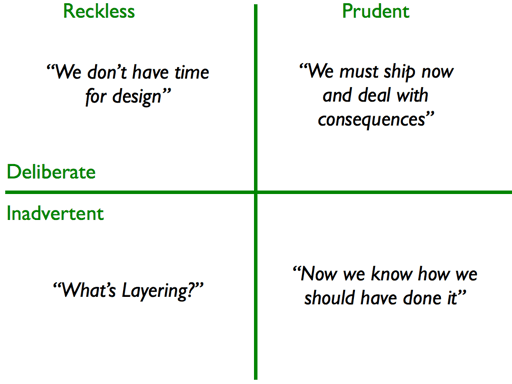
The Technical Debt Quadrant
The Technical Debt Quadrant reframes debt not as one problem, but a 2x2 matrix: prudent vs. reckless and deliberate vs. inadvertent. This distinguishes a strategic choice to ship early from a simple mess. The footgun is treating all debt as equally bad.
Niche Market Strategy: Big Wins in Small Ponds
A niche strategy means dominating a small, well-defined market instead of fighting for a slice of a large one. It's used by startups to gain a foothold or by large firms launching specialized products. The footgun is picking a niche too small to be profitable.
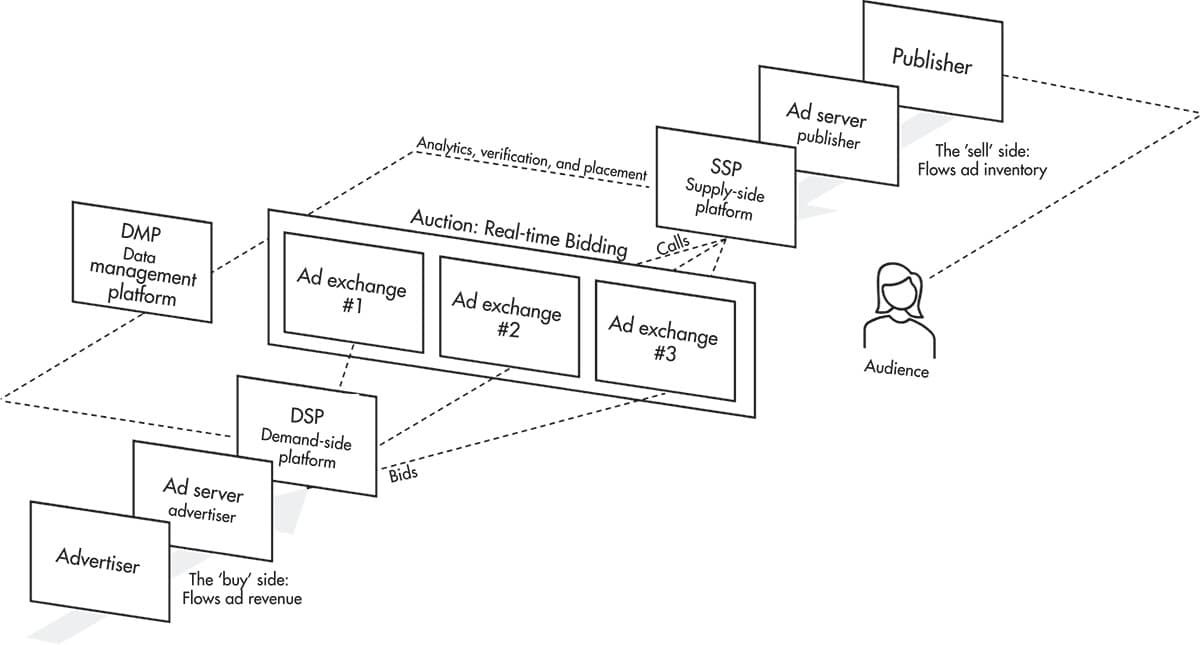
Real-Time Bidding (RTB): An Instant Auction for Every Ad
RTB treats every ad slot like a stock trade. The moment a page loads, an auction runs in milliseconds for advertisers to bid on showing their ad to you. It's how hyper-targeted ads appear instantly across different websites.
Drill-Down Analysis: From Summary to Specifics
Drill-down analysis moves from a high-level data summary to the granular details composing it. It's used in dashboards to investigate a metric's change, like clicking a monthly sales dip to see daily figures.
Mob Programming: The Whole Team on One Computer
Mob programming is like pair programming for the whole team: everyone works on one task, on one computer, at the same time. It's used for complex problems or onboarding. The footgun is letting it become a passive meeting instead of an active collaboration.

Business Model Canvas: Your Business on a Single Page
The Business Model Canvas puts your entire business strategy onto a single page, showing how value, customers, and money connect. It's used by startups to map out a plan or by established companies to launch new products.
Onboarding Checklists: Guide Users to Their 'Aha' Moment
An onboarding checklist is a guided to-do list showing new users the key actions to find value. It bridges the gap between a first tour and independent use, increasing task completion by 20-30%.
Cross-Tabulation: Finding Relationships in Your Data
Cross-tabulation reveals how two variables are related by counting their joint occurrences in a grid. It's key for survey analysis or A/B testing. The footgun is assuming correlation implies causation; the table shows a relationship, not its cause.
Epic: The Agile Placeholder for Big Ideas
An Epic is a large user story that's too big for a single sprint, acting as a placeholder for a major feature. Use it to group related stories for features like 'user profile management.'
Cost-Plus Pricing: Set Price Based on Cost, Not Value
Cost-plus pricing sets a product's price by adding a fixed percentage markup to its unit cost. It's common in government contracts where costs are clear. The footgun is that it ignores what customers are willing to pay, leaving money on the table.
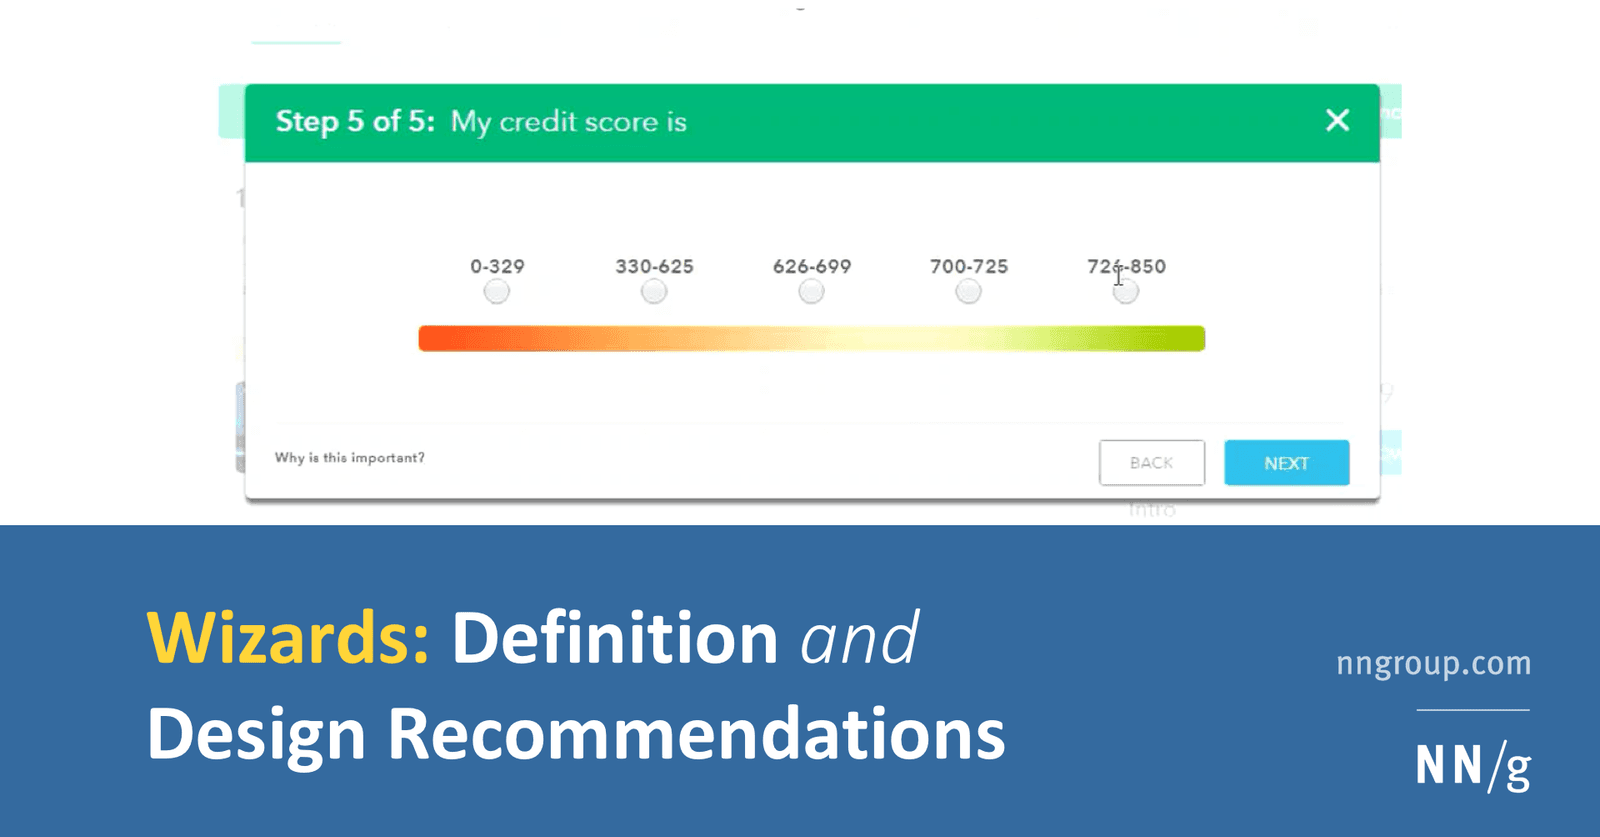
Setup Wizard: Guiding Users Through Complexity
A setup wizard turns a complex form into a simple, step-by-step conversation. It's ideal for infrequent but critical tasks like software installation, where the system determines the next best step. The footgun: A true wizard alters the user's *path*.

Ad Hoc Reporting: Answering One-Off Business Questions
Ad hoc reporting is your data "quick dive" for one-off questions, unlike static dashboards. A sales team might use it to see how a holiday affected regional sales.
INVEST: The Checklist for High-Quality User Stories
INVEST is a checklist for quality user stories: Independent, Negotiable, Valuable, Estimable, Small, and Testable. Use it in backlog grooming to ensure work is clear and sprint-ready.
Customer Lifetime Value (LTV): Predicting Future Customer Profit
LTV predicts the total net profit a customer will generate over their entire relationship with you. It guides how much to spend on acquiring customers (CAC) and helps identify your most valuable segments. The footgun: LTV is profit, not revenue.
Welcome Email Sequence: Guide Users from Signup to Value
A welcome email sequence guides new users from sign-up to experiencing your product's core value. It's crucial for SaaS products to reduce churn by encouraging key actions. The footgun is sending just one email and hoping users figure out the rest.

Data Visualization: Turning Numbers into Insight
Data visualization turns raw data into pictures, revealing stories that numbers alone can't tell. It's used to spot trends, find outliers, and grasp complex relationships in datasets.

Agile Themes: Connecting Work to Strategy
An agile theme is a strategic focus that groups related epics to achieve a larger business goal. Use themes to show stakeholders how specific features contribute to quarterly objectives like 'Improve Mobile Performance.'

Unit Economics: Is Each Customer Profitable?
Unit economics asks if you make or lose money on a single customer or sale. It's used in SaaS to compare customer lifetime value (LTV) to acquisition cost (CAC). The footgun is defining the 'unit' poorly, hiding that each new customer costs you money.
We are hiring for this. Every open role lists the topics its interview covers, so you can prepare for the real thing rather than guessing.
See open roles