Concepts in Product Management, page 11
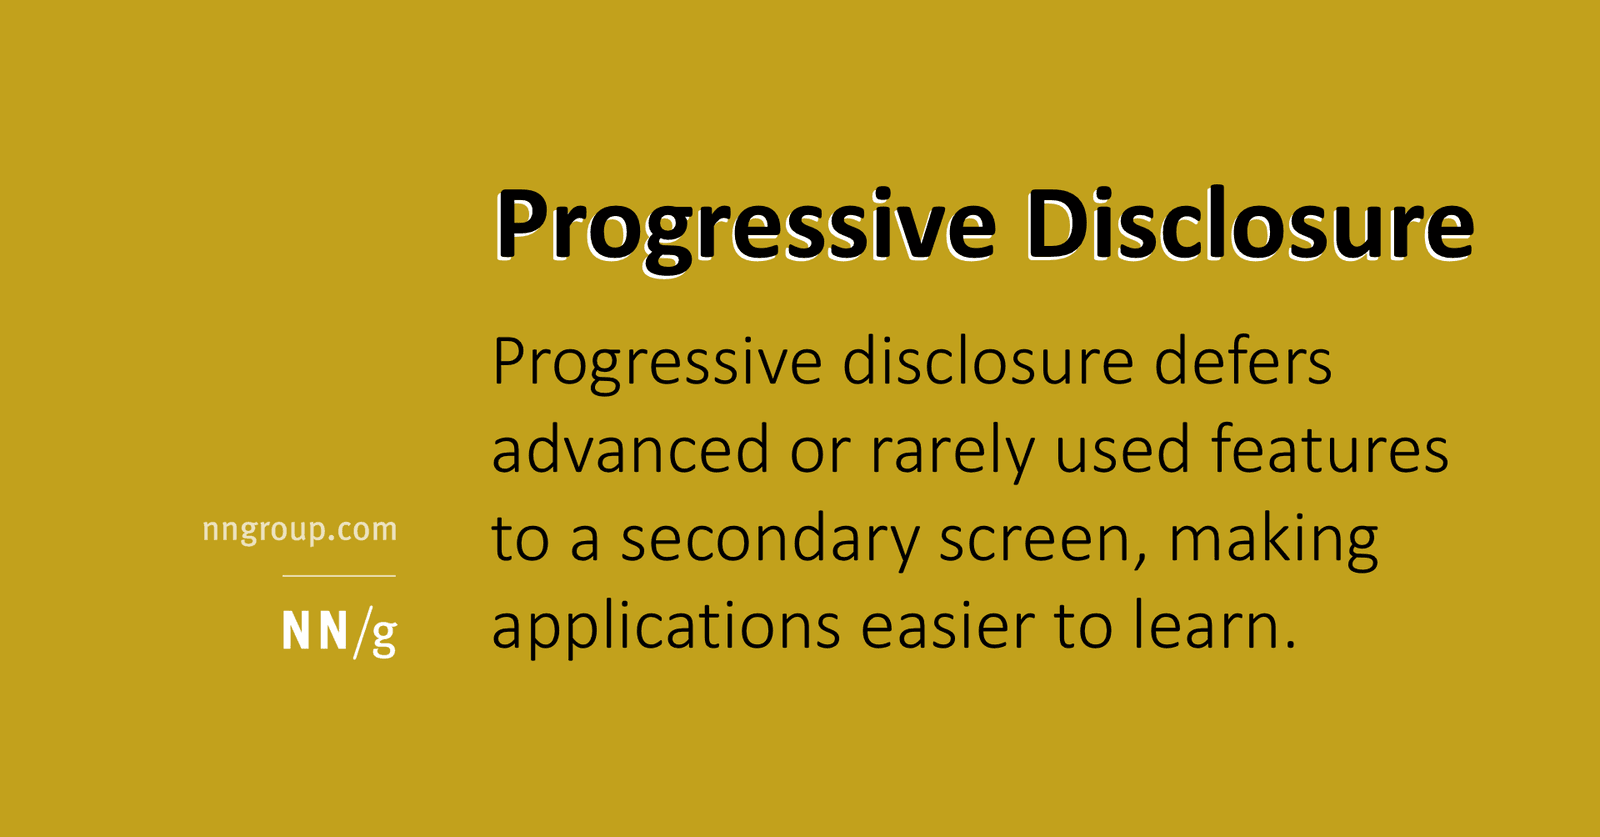
Progressive Disclosure: Show Less, Reveal More
Progressive disclosure manages complexity by showing only essential features upfront, like a "Read More" button for your UI. It's used in print dialogs and e-commerce specs to avoid overwhelming users.
Benchmarking: Know Where You Stand in Your Industry
Benchmarking answers "Are we good?" by comparing your performance metrics against industry bests. It's used to set realistic goals for cost, quality, or time. The main footgun is comparing apples to oranges—using benchmarks from dissimilar companies.

What is a DEEP Product Backlog?
A DEEP backlog prevents the 'quicksand' of endless refinement with no progress. It helps teams align on customer value and create reliable plans. The footgun is that without a structured approach, backlogs become chaotic, eroding trust in agile forecasts.
LTV to CAC Ratio: Is Your Growth Profitable?
The LTV to CAC ratio measures if you make more money from a customer than you spent to get them. It's the core health metric for a subscription business, used to judge marketing efficiency. A ratio above 3:1 is often healthy.
Interactive Walkthroughs: Learn by Doing, Not Just Seeing
An interactive walkthrough teaches by doing. Instead of clicking 'Next,' users must perform the actual task to advance. It's best for critical onboarding flows where learning a workflow is key to activation.
Exception Reporting: Focus on Signals, Not Noise
Exception reporting filters out the noise, showing only data that breaks predefined rules. It's used in financial reconciliation to flag mismatched transactions or to alert on system performance dips.

Job Stories: Focus on Motivation, Not Persona
A Job Story shifts focus from *who* is doing something to *why*. It frames work around a situation, a motivation, and an outcome. Use it when a user's context is more important than their persona. The footgun is simply rephrasing a user story.

Van Westendorp Price Sensitivity Meter
The Van Westendorp Price Sensitivity Meter is a market research technique for determining consumer price preferences. It's used to help set product prices by surveying potential buyers about their perceived value and willingness to pay.
Contextual Onboarding: Just-in-Time User Guidance
Contextual onboarding delivers guidance exactly when a user needs it, triggered by their actions. It introduces core features step-by-step as users explore, preventing overwhelm.
The Semantic Layer: A Business Map for Company Data
A semantic layer is a translation dictionary for data, mapping cryptic database columns to plain business terms like "Revenue." It lets non-technical teams build reports without writing SQL.
Personas: Build for a Specific 'Who', Not a Vague 'Everyone'
Personas give your team a shared user understanding by creating a fictional, yet realistic, character profile. They guide feature prioritization and design decisions by focusing on a specific "who."

SMART Goals: From Vague Hopes to Actionable Plans
SMART goals turn fuzzy ambitions into concrete plans by forcing clarity. It's a checklist for ensuring a goal is Specific, Measurable, Assignable, Realistic, and Time-bound. Use it for project planning or performance reviews to create trackable progress.

Personalized Onboarding: One Size Fits None
Personalized onboarding guides users based on their role or goal, not a generic script. It's key for apps with diverse user types, showing marketers and engineers different paths to value. The footgun is a one-size-fits-all tour that buries their "aha!"

Anscombe's Quartet: When Numbers Lie
Anscombe's Quartet shows how four datasets can share identical summary stats (mean, variance) but look completely different when plotted. It's a classic reminder to always visualize your data before trusting numerical summaries.
Relative Sizing: Estimate Effort, Not Hours
Relative sizing compares work items to each other instead of assigning absolute hours. A team agrees on a baseline task and estimates others as 'larger' or 'smaller' relative to it, often using story points. The footgun is mapping points back to hours.
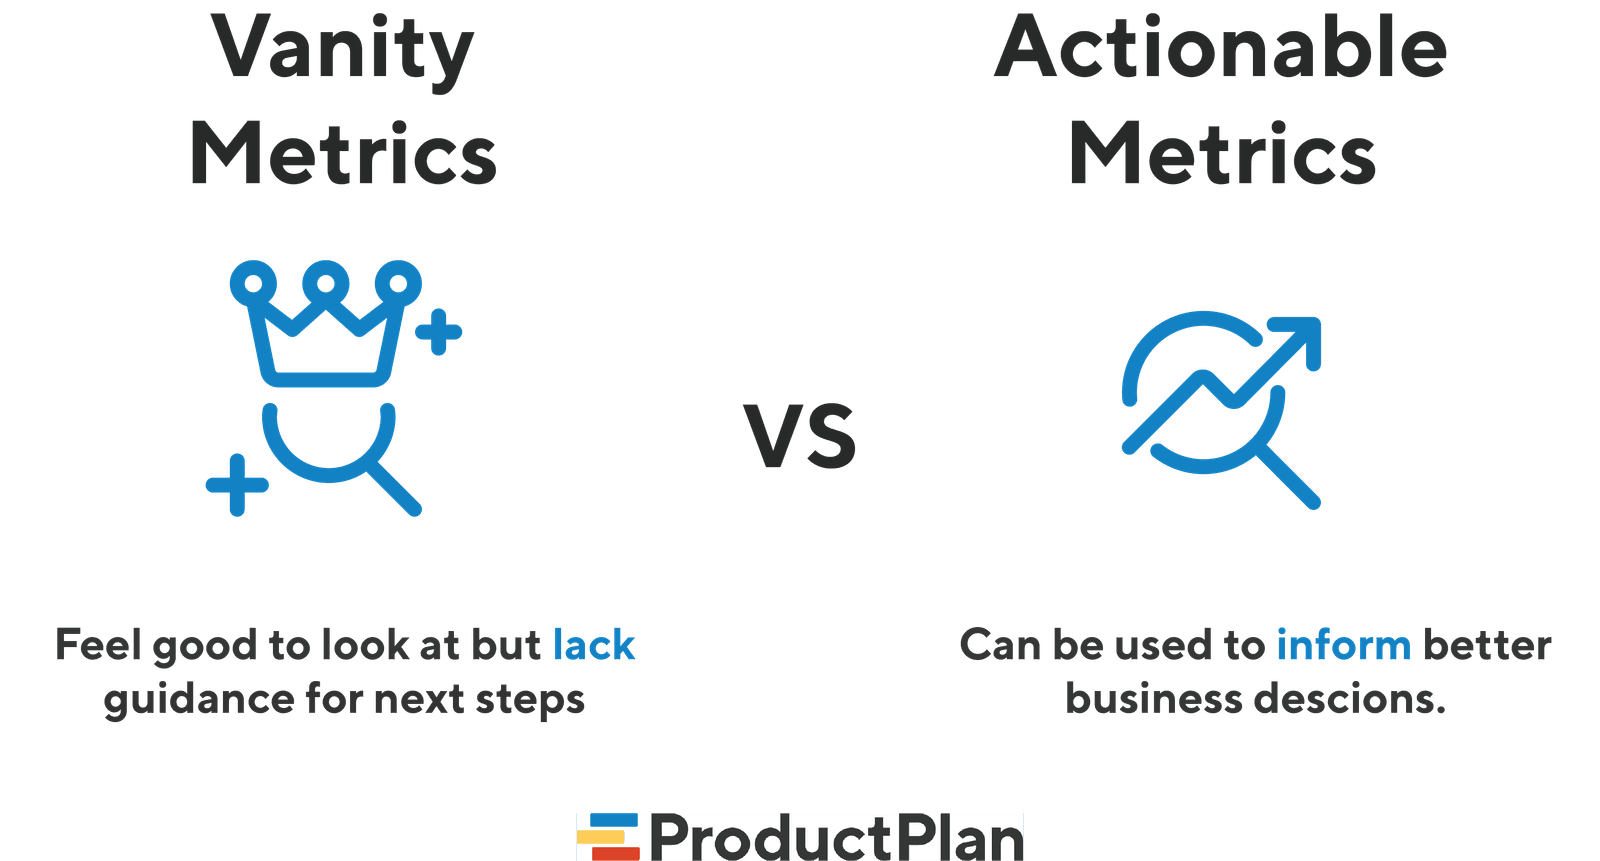
Vanity vs. Actionable Metrics: Measure What Matters
Vanity metrics look impressive but don't inform decisions (e.g., total downloads). Actionable metrics tie to business goals and guide your next move (e.g., conversion rate). This helps product teams focus on real growth, not just impressive-looking charts.
Onboarding Gamification: Guiding Users with Game Mechanics
Onboarding gamification uses game-like elements to guide new users through key actions, turning a checklist into a challenge. It's used to boost activation by making initial setup feel rewarding, like earning a badge for completing your profile.

Chart Selection: Match Purpose, Not Looks
Start with the purpose, not the chart. The question you're asking—'how do these compare?' or 'what's the trend?'—determines the best visualization. A line chart shows trends; a bar chart compares categories.

Buy a Feature: Prioritize by Making Customers Spend
Buy a Feature turns prioritization into a game where customers spend a limited budget on their desired features. It's used in product planning to force trade-offs and reveal true value.
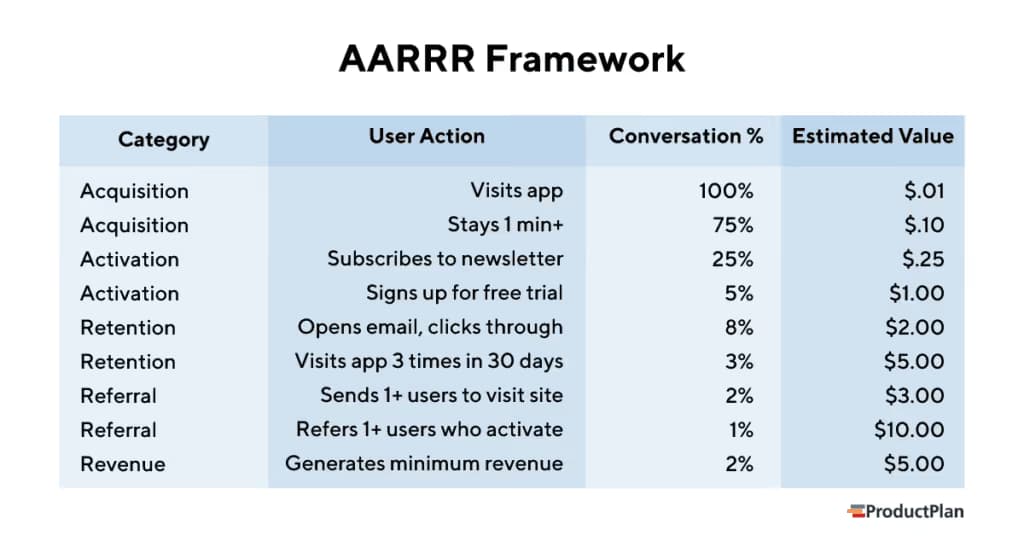
AARRR 'Pirate' Metrics: A Funnel for What Really Matters
The AARRR framework is a five-stage funnel (Acquisition, Activation, Retention, Referral, Revenue) that tracks the user journey. It helps product teams focus on metrics that directly impact business health, not vanity metrics like social media likes.
We are hiring for this. Every open role lists the topics its interview covers, so you can prepare for the real thing rather than guessing.
See open roles