Concepts in Product Management, page 18
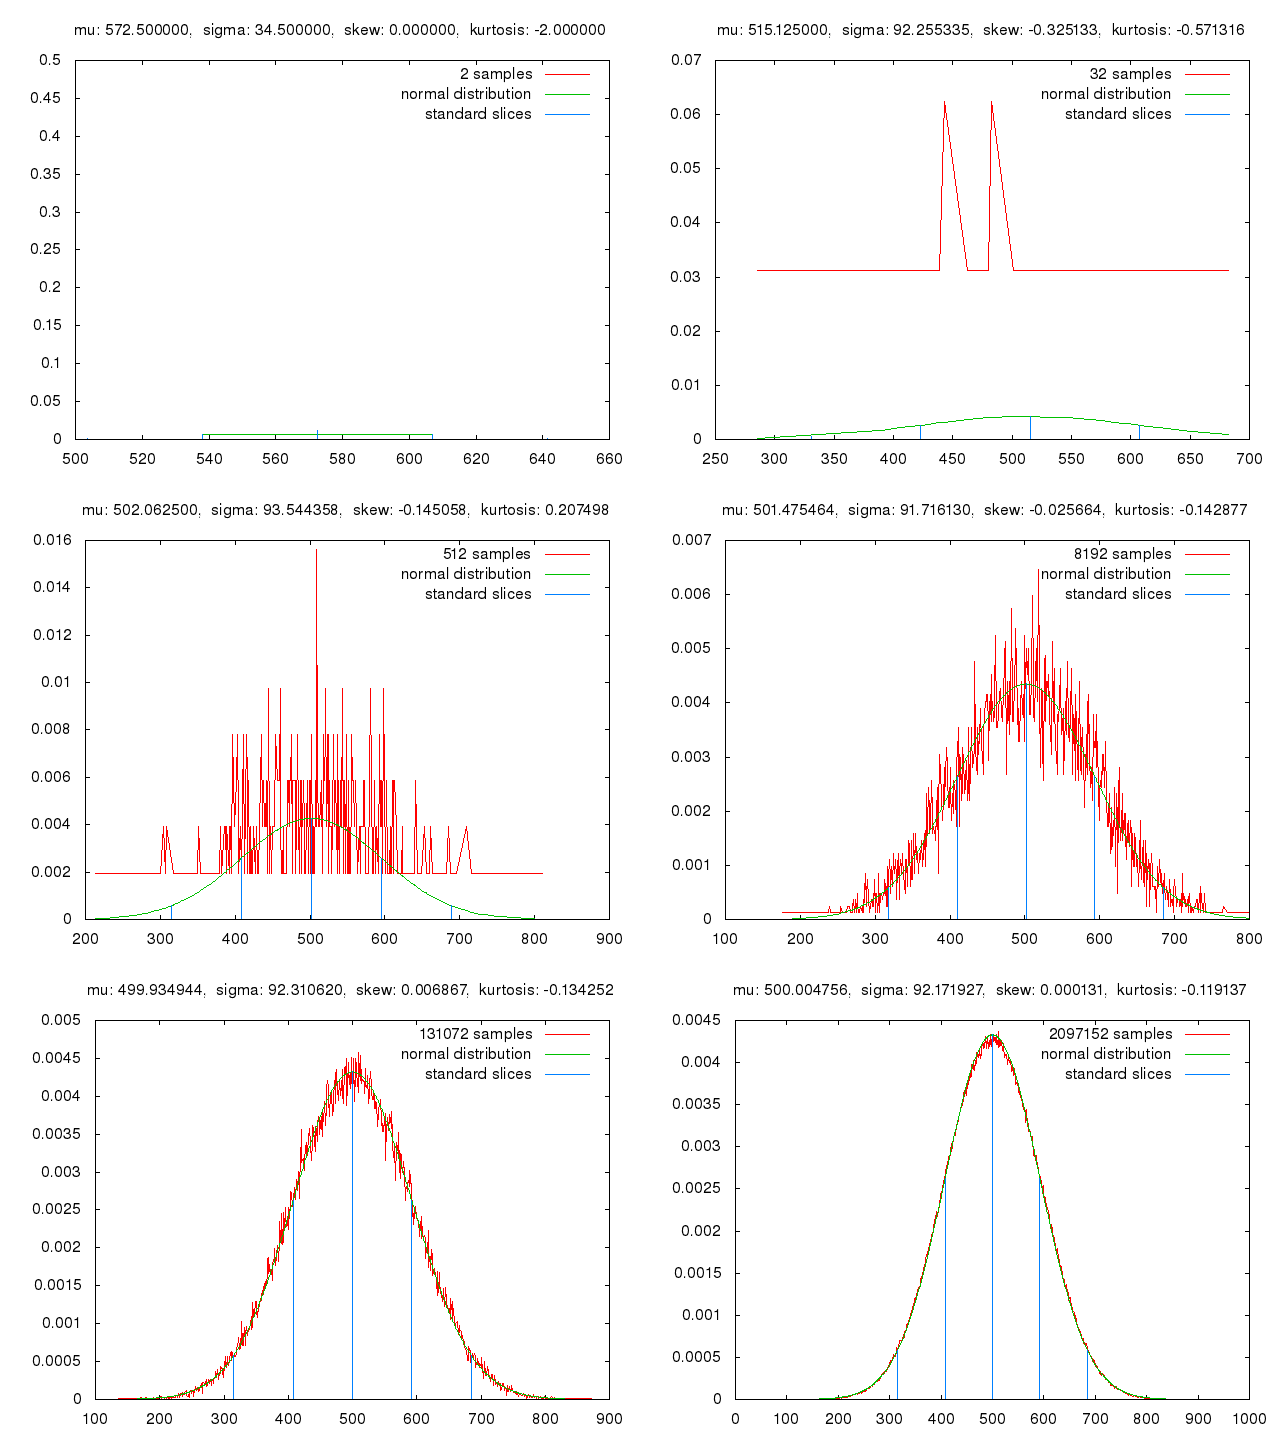
Forecasting with Monte Carlo Simulation
A Monte Carlo simulation forecasts outcomes by running thousands of 'what if' scenarios with random inputs. Use it to model complex systems like user growth with variable conversion rates.

The Multiple Comparisons Problem
Running many statistical tests on one dataset is like buying many lottery tickets; your chance of a "winning" false positive increases with each test. This happens in A/B tests with many metrics.
ATDD: Aligning Code with Business Needs Before You Build
Acceptance Test-Driven Development (ATDD) is a communication framework where business, developers, and testers write acceptance tests together *before* coding begins. This ensures everyone understands the requirements.
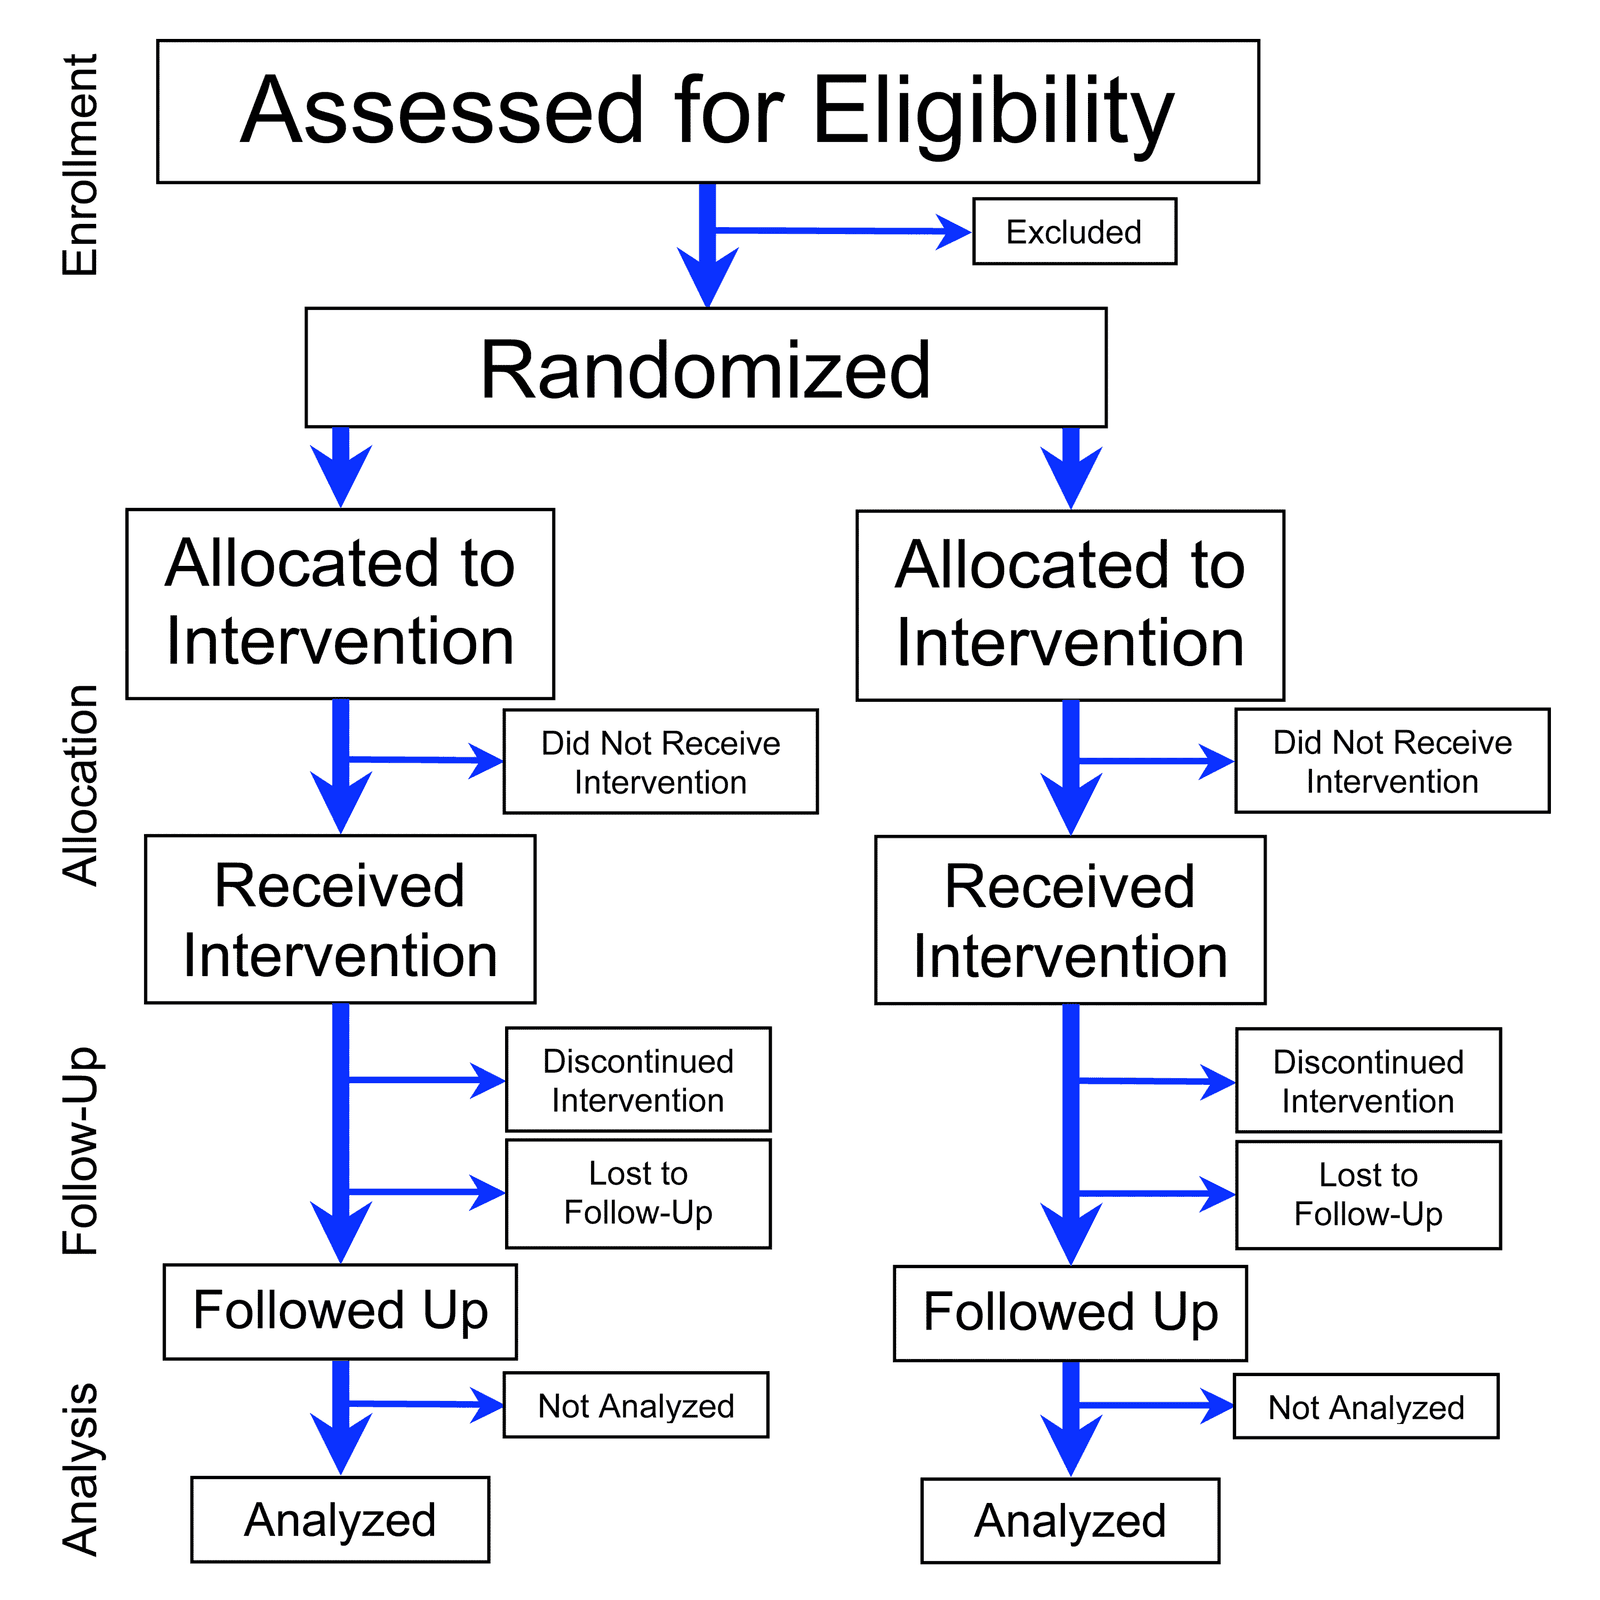
Randomized Controlled Trials: The Gold Standard for 'Did It Work?'
An RCT is a science fair experiment for business decisions, isolating one change to see its true effect. It's used in A/B tests to prove a new feature worked. The biggest footgun is peeking at results early, which can lead to false conclusions.

Product Sunsetting: Retiring Products Gracefully
Product sunsetting is the managed process of retiring a product to free up resources. It's used when a product is no longer profitable or strategically relevant. The biggest footgun is a sudden shutdown without a clear migration path, which alienates users.
Causal Impact: Measuring Effects Without an A/B Test
Causal Impact estimates an intervention's effect by modeling a 'what if' counterfactual. It's used to measure lift from a new feature or ad campaign when a clean A/B test isn't possible.
Empathy Mapping: Seeing Through Your User's Eyes
An empathy map is a tool for a team to build a shared picture of a user's mind, not just their actions. It's used in UX design to align on user needs before building. The footgun is treating it as a one-time checklist instead of.
Product Line Strategy: Selling a Family of Products
A product line strategy sells a family of related products individually, not as a bundle. It's used to capture different market segments, like offering 'good, better, best' software tiers or car trims.
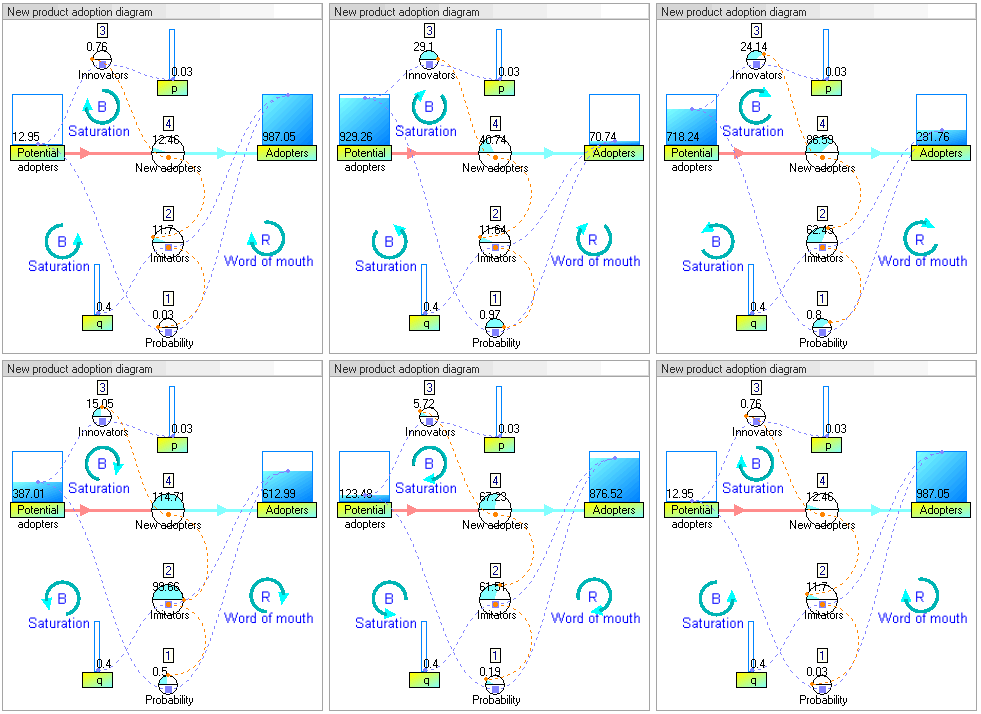
System Dynamics: Modeling with Stocks, Flows, and Feedback
System Dynamics models the world as interconnected stocks (like users) and flows (like signups), governed by feedback loops. Use it to understand why growth stalls or why hiring lags behind need.
Selection Bias: When Your Sample Skews Your Results
Selection bias occurs when your data sample isn't random, leading to flawed conclusions. This happens when surveying only volunteers or analyzing a non-representative group. The footgun is assuming your data reflects the whole population when it doesn't.

Value Proposition Canvas: Map Customer Needs to Product Features
The Value Proposition Canvas maps customer needs to product features to ensure you're building something people want. It connects customer "jobs," "pains," and "gains" to your product's features.

Portfolio Roadmap: The Strategy Across Your Products
A portfolio roadmap is the top-line strategy for a group of related products, ensuring they all pull in the same direction. Use it to align multiple product lines with business objectives.

ETL vs. ELT: When to Transform Your Data
ETL (Extract, Transform, Load) preps data before storage, like a chef prepping ingredients. ELT loads raw data first, transforming it inside the warehouse. Use ETL for structured reporting; use ELT for flexibility with raw data.
Twyman's Law: Interesting Data is Usually Wrong
Twyman's Law states that any data point that looks interesting is probably wrong. Before celebrating a sudden 10x spike in user engagement, first suspect a bug in your analytics pipeline or a bot attack.

Lean Canvas: A Startup's Reality Check on a Page
A Lean Canvas is a one-page business plan that forces you to define and test your riskiest assumptions first. Startups use it to validate their core idea before building. The biggest mistake is treating it as a one-time exercise instead of a living document.
GE-McKinsey Nine-Box Matrix: Portfolio Strategy Beyond the 2x2
The GE-McKinsey matrix plots business units on a 3x3 grid to guide 'invest, hold, or divest' decisions. It's used to prioritize investments by weighing multiple factors for market attractiveness and business strength, not just market share and growth.
Feature Management: Control Releases After You Deploy
A feature management platform decouples code deploys from feature releases. It centralizes control over who sees what, turning simple code toggles into a powerful system for canary releases, A/B tests, and targeted rollouts, all from a UI.
The Counterfactual Framework for Causal Inference
The Counterfactual Framework models causality by imagining two parallel universes for each person: one with a treatment, one without. It's the basis for A/B tests and analyzing observational data.

Customer Journey Mapping: Walk in Your Customer's Shoes
A customer journey map is a storyboard of a user's experience, showing every interaction from their perspective. Use it to find pain points in a signup flow or support process. The biggest footgun is mapping an ideal path, not the messy reality.
Brand Architecture: Your Company's Brand Family Tree
Brand architecture is a family tree for a company's products, organizing how the main corporate brand relates to its sub-brands. It dictates whether a new product gets the parent's name or a standalone identity, maximizing value across the portfolio.
We are hiring for this. Every open role lists the topics its interview covers, so you can prepare for the real thing rather than guessing.
See open roles