More in Design & UX — page 35
Proof Points Turn Claims Into Credibility
A proof point is the 'show, don't tell' of marketing: a specific fact, stat, or testimonial that makes a claim believable. You see them on landing pages and sales decks. The footgun is vague social proof that does not match the specific promise.

E-E-A-T: Google's Human Quality Bar for Content
E-E-A-T is how Google's human reviewers judge if content is truly helpful or merely optimized. It matters most for health and finance, where bad advice causes real harm.

Trademark Usage: Treat Brands as Adjectives
A trademark is an adjective, never a verb. When writing copy or UI text, use ™ for unregistered and ® for registered marks, and distinguish them from surrounding text. The footgun is treating brands as verbs or implying endorsement when citing third parties.
Slugline: The Screenplay Scene Marker
A slugline is the screenplay element that announces a new scene. It anchors the script's structured format by marking scene changes and setting the stage for the action and dialogue that follow.
The 4 P's Formula: Picture, Promise, Prove, Push
The 4 P's formula structures persuasive copy in four steps: picture, promise, prove, push. It shines in emails and landing pages that must convert attention fast.
The Rainbow Spreadsheet: Collaborative UX Observation
A Rainbow Spreadsheet makes UX research a team sport. It's a shared doc where observers log findings in real-time, with each participant assigned a color. This replaces a slow, formal report and builds shared understanding.
Qualitative Coding: Turning User Chatter into Actionable Themes
Think of thematic analysis as creating a tag cloud for user interviews. It groups raw feedback into meaningful patterns, turning noise into signal. Used after interviews to make sense of transcripts, the biggest mistake is just describing what users said.
MaxDiff Analysis: Find True Preferences, Not Just Ratings
MaxDiff finds what people truly value by asking them to pick the "best" and "worst" from a small set, not just rate them. Use it to rank features or messages without the ambiguity of 1-5 scales.
Multivariate Testing: Find Which UI Changes Interact
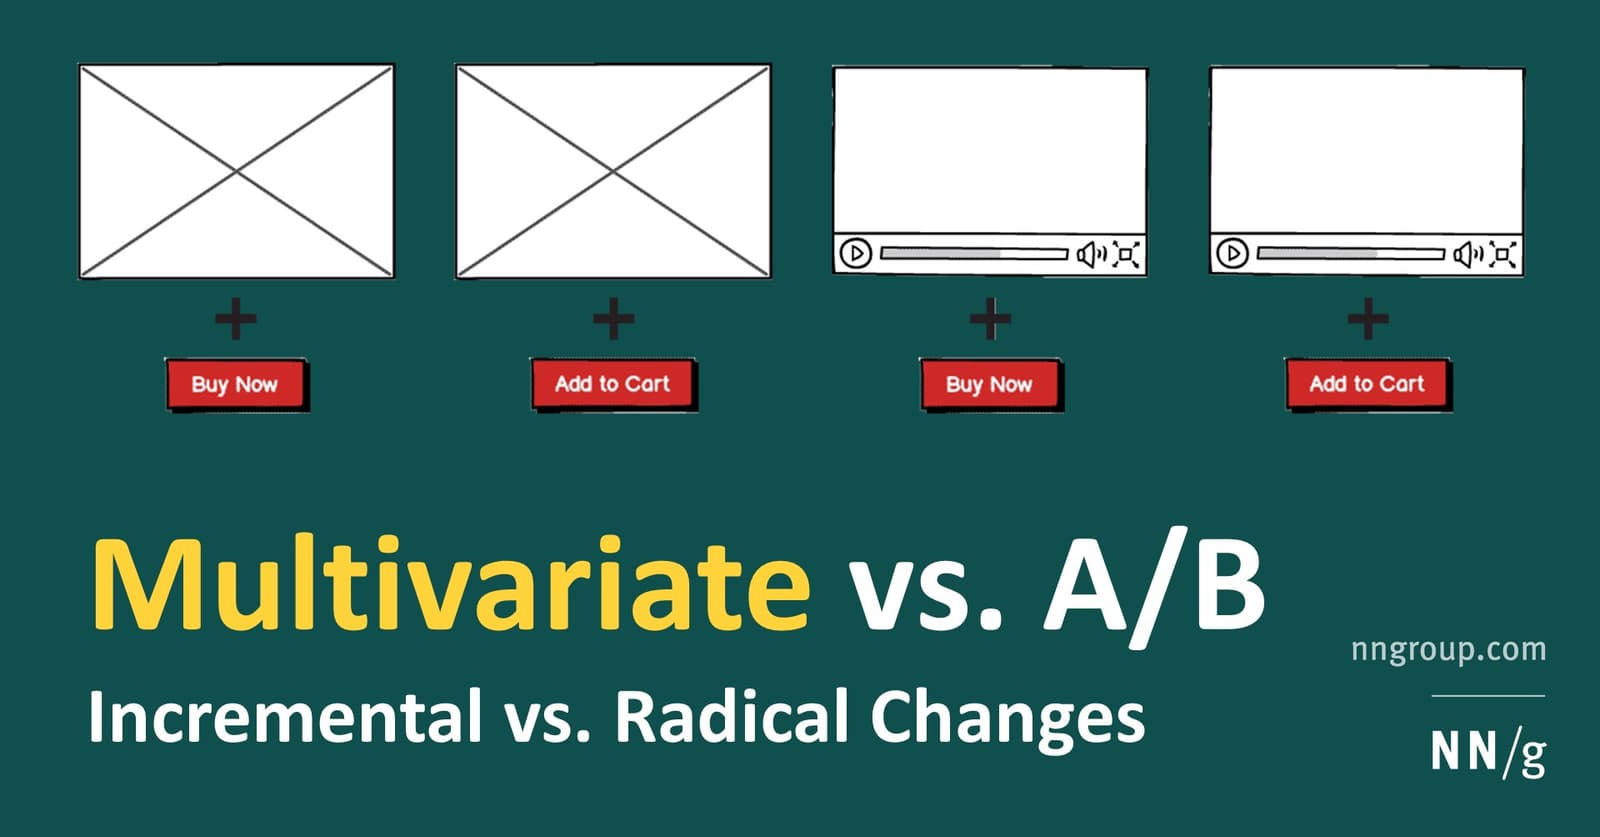
Multivariate testing finds the best *combination* of UI changes, not just which single design wins. Use it to see how a new headline interacts with a new button on a high-traffic page. The footgun: it requires far more traffic than A/B testing to get a.
Clickstream Analysis: Following the User's Footsteps
Clickstream analysis is like watching a replay of a user's journey through your site, click by click. It's used to optimize conversion funnels and find friction points. The footgun is focusing on the *what* (the path) without asking *why* a user took it.

Survey Response Bias: When Answers Mislead
Survey answers aren't raw data; they're filtered through human psychology. Response bias describes the predictable ways people answer inaccurately, common in user surveys and market research. The footgun is taking responses at face value, ignoring biases.

Customer Effort Score (CES): Measure Task Friction
Customer Effort Score (CES) measures how much work a customer expends to complete a task. It answers 'How easy was it?' right after a support interaction, purchase, or onboarding.
P-Value: Gauging Surprise, Not Certainty
A p-value measures surprise: it's the probability of seeing your results by chance, assuming your change had no effect. It's used in A/B testing to decide if an effect is noise or significant. A small p-value doesn't prove your hypothesis is true.
Heatmaps: Visualizing User Attention
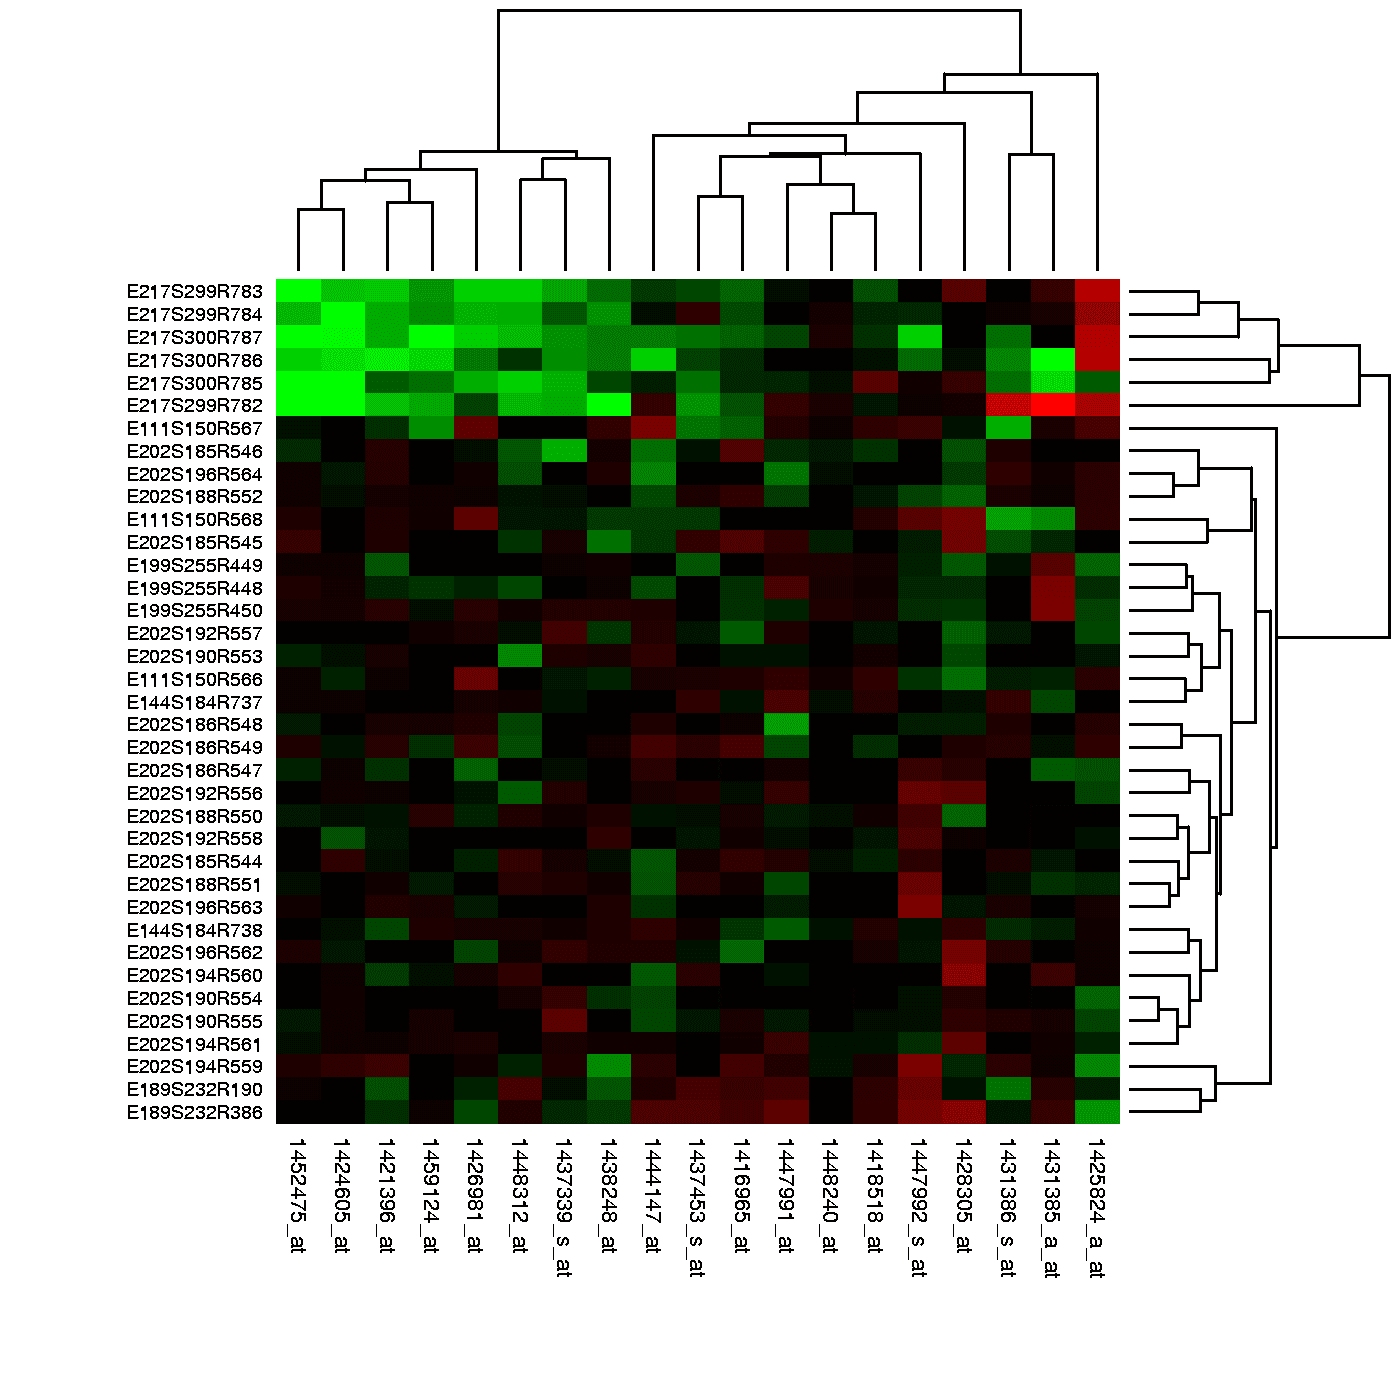
Think of a heatmap as a weather map for your app, showing 'hot' spots of user clicks and 'cold' spots they ignore. It reveals if users are clicking key buttons or getting distracted. The footgun: a hot spot can mean rage-clicks, not just engagement.
CSAT: Measuring If You Met Customer Expectations
CSAT measures if your product met a customer's expectations for a specific interaction. It's used to evaluate experiences like a support call or purchase, giving a direct pulse check on service quality.

Likert Scale: A Ruler for Opinions
A Likert scale turns subjective feelings into data by asking users to rate their agreement with a statement on a balanced scale. It's used in UX surveys to gauge attitudes.
Pluralistic Walkthrough: Diverse Roles, One User Task
A pluralistic walkthrough is a group critique where developers, users, and UX pros role-play as end-users to find flaws in a design. It's used early to catch issues cheaply. The footgun is letting developers defend their work instead of listening.
GOMS Model: Predicting User Performance as a Script
The GOMS model predicts expert user performance by breaking down tasks into a script of Goals, Operators, Methods, and Selection rules. It's used to get quantitative estimates of task efficiency, but its footgun is assuming a perfect user who never makes…
Eye Tracking: See What Your Users Actually See
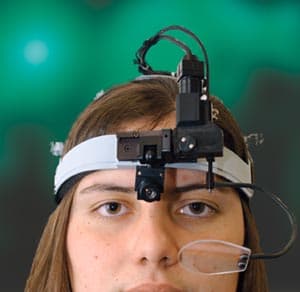
Eye tracking reveals what users actually look at, not just what they say they do. It's used in UX to generate heatmaps showing which UI elements draw the eye. The footgun: a long gaze can mean interest, but it can also mean confusion.

Desirability Testing: Quantifying User Feelings
Desirability testing quantifies user feelings with a controlled vocabulary, asking them to pick words from a list that describe a design. It measures emotional response to visual appeal or UX, often with just a screenshot.