Intermediate concepts in Product Management, page 6
Outcome-Based Roadmaps: Solve Problems, Not Ship Features
An outcome-based roadmap frames work around problems to solve, not a checklist of features to build. It gives teams autonomy to find the best solution for goals like increasing user engagement or improving conversion.
Notification Preference Center: Granular Control to Reduce Churn
A notification preference center gives users granular control, not just a global unsubscribe. It lets them choose what (updates vs. reminders), where (email vs. push), and how often (real-time vs.
Roadmap Capacity Planning: Ideal vs. Reality
Capacity planning isn't about your team's ideal output (design capacity), but their actual output (effective capacity) after accounting for meetings, bugs, and on-call. Use it to build realistic roadmaps.
Statistical Significance: Is Your Result Real or Just Random?
Statistical significance checks if a result is a real effect or just random chance. It answers: 'How surprising is this data if my change had no effect?' It's used in A/B tests to validate new features. The footgun: a significant result isn't always important.
P-value: Probability of Your Data, Not Your Hypothesis
A p-value measures how surprising your data is, assuming your null hypothesis (e.g., "no change") is true. It's used in A/B tests to decide if an effect is real. The footgun: a low p-value doesn't prove your theory, it just casts doubt on the null.

Confidence Interval: Quantifying Uncertainty in Your Estimates
A confidence interval puts error bars around a measurement, showing the plausible range for a true value. It's used in A/B tests to report not just a winner, but the range of its likely impact.
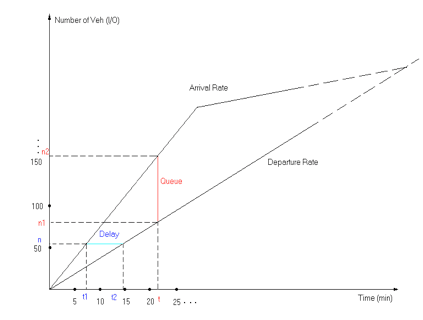
Cumulative Flow Diagrams: Spotting Workflow Bottlenecks
A Cumulative Flow Diagram is a geological cross-section of your project, showing work moving through states over time. Agile teams use it to spot bottlenecks by seeing where tasks pile up. The footgun is misinterpreting a widening band as a failure.

Tiered Pricing: One Product, Many Prices
Tiered pricing sells one product at multiple prices by packaging features for different customer needs. It's common in SaaS (Basic, Pro, Enterprise plans) and telecoms.
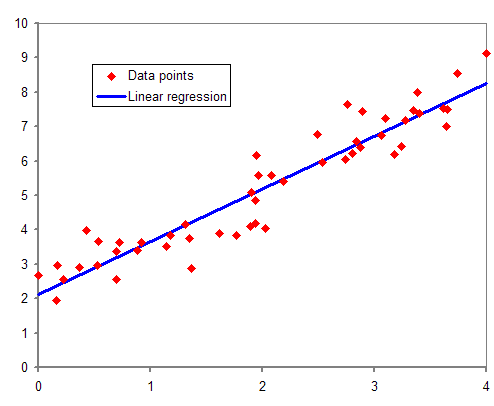
Regression Analysis: Finding the Line of Best Fit
Regression analysis draws a line through data to model relationships between variables. Use it to predict a house price from its square footage or forecast sales from ad spend. The footgun: a strong correlation doesn't prove one variable causes the other.

Fishbone Diagram: Mapping Problems to Root Causes
A fishbone diagram maps a problem to its potential root causes. It's a structured brainstorming tool used in retrospectives or post-mortems to explore *why* something happened.

Usage-Based Pricing: Pay for Value, Not Seats
Usage-based pricing links cost directly to consumption, letting customers pay for what they use instead of a flat fee per user. It's common for cloud services (AWS) and APIs where value isn't tied to seats.
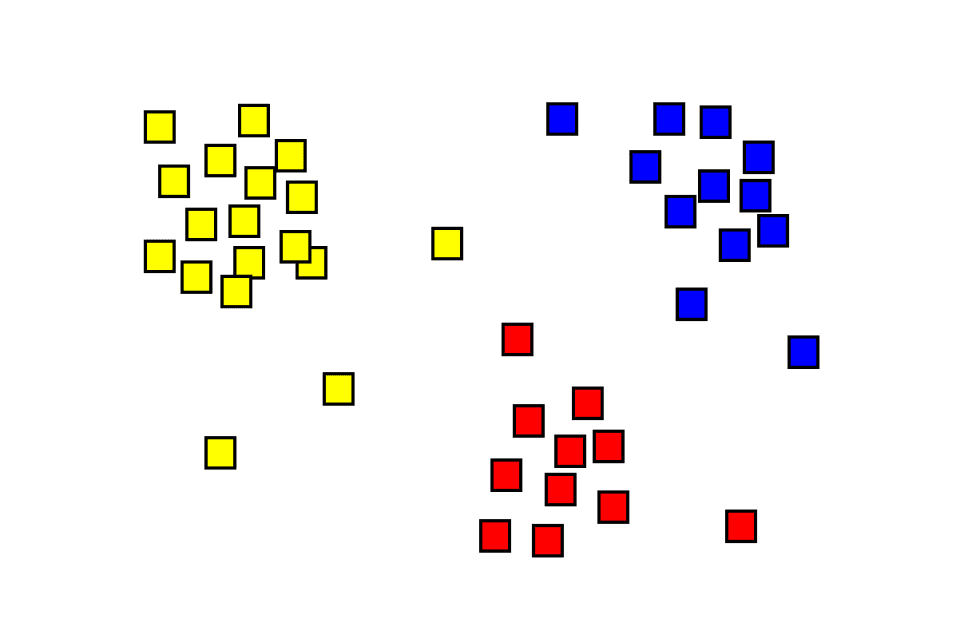
Cluster Analysis: Finding Hidden Groups in Your Data
Cluster analysis automatically finds natural groupings in unlabeled data, like sorting a mixed bag of Legos without a manual. It's used for customer segmentation or anomaly detection.

SMART Goals: From Vague Hopes to Actionable Plans
SMART criteria turn vague hopes into concrete plans by forcing goals to be Specific, Measurable, Achievable, Relevant, and Time-bound. It's used in project planning and performance reviews.
Outlier Detection: Finding Data That Doesn't Belong
Outlier detection finds data points that don't fit the pattern, signaling an error, fraud, or a new event. It's used to spot faulty sensor readings or fraudulent transactions.
Radical Candor: Care Personally, Challenge Directly
Radical Candor is a feedback framework that combines caring personally with challenging directly. It's used to give clear, kind guidance—both praise and criticism—that helps people grow.
ICE Scoring: Prioritize Features with a Quick Gut Check
ICE scoring is a gut-check for prioritizing features by multiplying Impact, Confidence, and Ease. It helps teams rapidly sort experiments or backlog items. The main footgun is its bias towards easy wins, potentially ignoring high-effort strategic projects.

The 4Ls Retrospective: Loved, Loathed, Longed For, Learned
The 4Ls retrospective is a structured way to capture a team's feelings after a project. It asks what they Loved, Loathed, Longed for, and Learned to create an action plan. A common pitfall is only focusing on negatives, missing key insights from the other Ls.

Buy vs. Build: A Strategic Choice, Not a Cost Problem
The Buy vs. Build decision is a strategic choice, not just a cost problem. Buy commodity functions to gain speed and stability; build core features to create a unique competitive advantage. The footgun is ignoring total cost of ownership and strategic control.
Opportunity Cost: The Value of the Road Not Taken
Opportunity cost is the value of the best alternative you forgo when making a choice. It's used to prioritize projects when resources are scarce, like choosing a new feature over a refactor. The footgun is ignoring non-monetary costs like lost time or utility.
Test-Driven Development: The Red, Green, Refactor Cycle
Test-Driven Development (TDD) flips the script: you write a failing test *before* the feature code. This 'Red, Green, Refactor' cycle ensures every piece of code is testable. It's common in agile for building robust features.
We are hiring for this. Every open role lists the topics its interview covers, so you can prepare for the real thing rather than guessing.
See open roles