Concepts in UX Research, page 3

Likert Scale: A Ruler for Opinions
A Likert scale turns subjective feelings into data by asking users to rate their agreement with a statement on a balanced scale. It's used in UX surveys to gauge attitudes.
CSAT: Measuring If You Met Customer Expectations
CSAT measures if your product met a customer's expectations for a specific interaction. It's used to evaluate experiences like a support call or purchase, giving a direct pulse check on service quality.
Heatmaps: Visualizing User Attention
Think of a heatmap as a weather map for your app, showing 'hot' spots of user clicks and 'cold' spots they ignore. It reveals if users are clicking key buttons or getting distracted. The footgun: a hot spot can mean rage-clicks, not just engagement.
P-Value: Gauging Surprise, Not Certainty
A p-value measures surprise: it's the probability of seeing your results by chance, assuming your change had no effect. It's used in A/B testing to decide if an effect is noise or significant. A small p-value doesn't prove your hypothesis is true.

Customer Effort Score (CES): Measure Task Friction
Customer Effort Score (CES) measures how much work a customer expends to complete a task. It answers 'How easy was it?' right after a support interaction, purchase, or onboarding.

Survey Response Bias: When Answers Mislead
Survey answers aren't raw data; they're filtered through human psychology. Response bias describes the predictable ways people answer inaccurately, common in user surveys and market research. The footgun is taking responses at face value, ignoring biases.
Clickstream Analysis: Following the User's Footsteps
Clickstream analysis is like watching a replay of a user's journey through your site, click by click. It's used to optimize conversion funnels and find friction points. The footgun is focusing on the *what* (the path) without asking *why* a user took it.
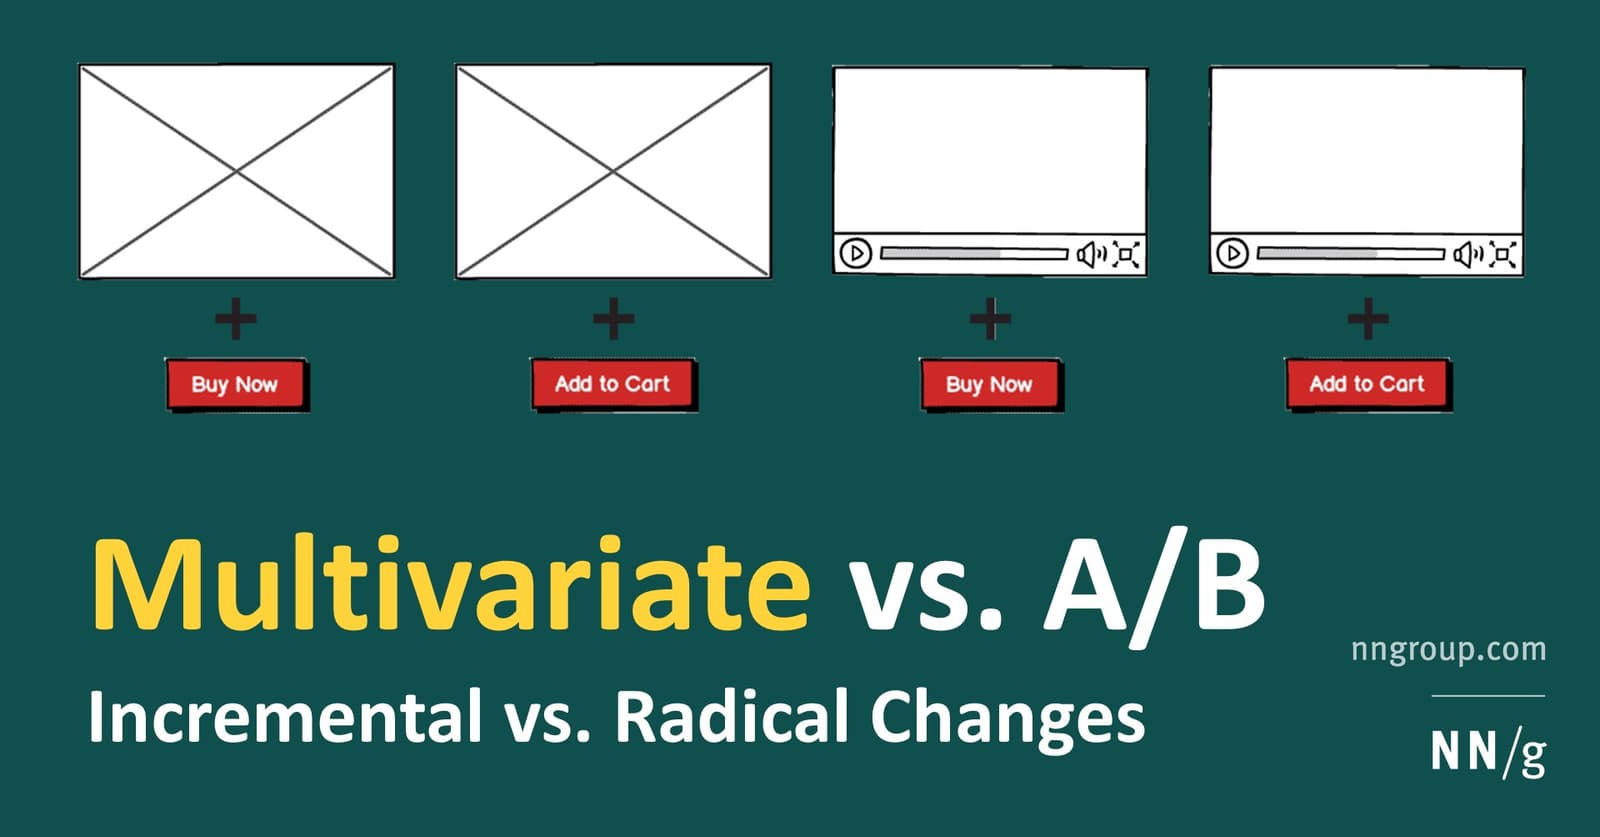
Multivariate Testing: Find Which UI Changes Interact
Multivariate testing finds the best *combination* of UI changes, not just which single design wins. Use it to see how a new headline interacts with a new button on a high-traffic page. The footgun: it requires far more traffic than A/B testing to get a.
MaxDiff Analysis: Find True Preferences, Not Just Ratings
MaxDiff finds what people truly value by asking them to pick the "best" and "worst" from a small set, not just rate them. Use it to rank features or messages without the ambiguity of 1-5 scales.
Qualitative Coding: Turning User Chatter into Actionable Themes
Think of thematic analysis as creating a tag cloud for user interviews. It groups raw feedback into meaningful patterns, turning noise into signal. Used after interviews to make sense of transcripts, the biggest mistake is just describing what users said.
The Rainbow Spreadsheet: Collaborative UX Observation
A Rainbow Spreadsheet makes UX research a team sport. It's a shared doc where observers log findings in real-time, with each participant assigned a color. This replaces a slow, formal report and builds shared understanding.

AEIOU: Five Buckets for Field Notes
AEIOU sorts notes into five buckets—Activities, Environments, Interactions, Objects, Users—so patterns emerge from chaos. Use it during field studies to categorize raw data. The footgun is treating its categories as rigid rules not editable heuristics.
Content Analysis: Study Texts Without Interference
Content analysis extracts patterns from existing artifacts without disturbing subjects. Social scientists apply it systematically to speeches, photographs, and essays. The common footgun is treating it as writing-only and ignoring visual or spoken media.
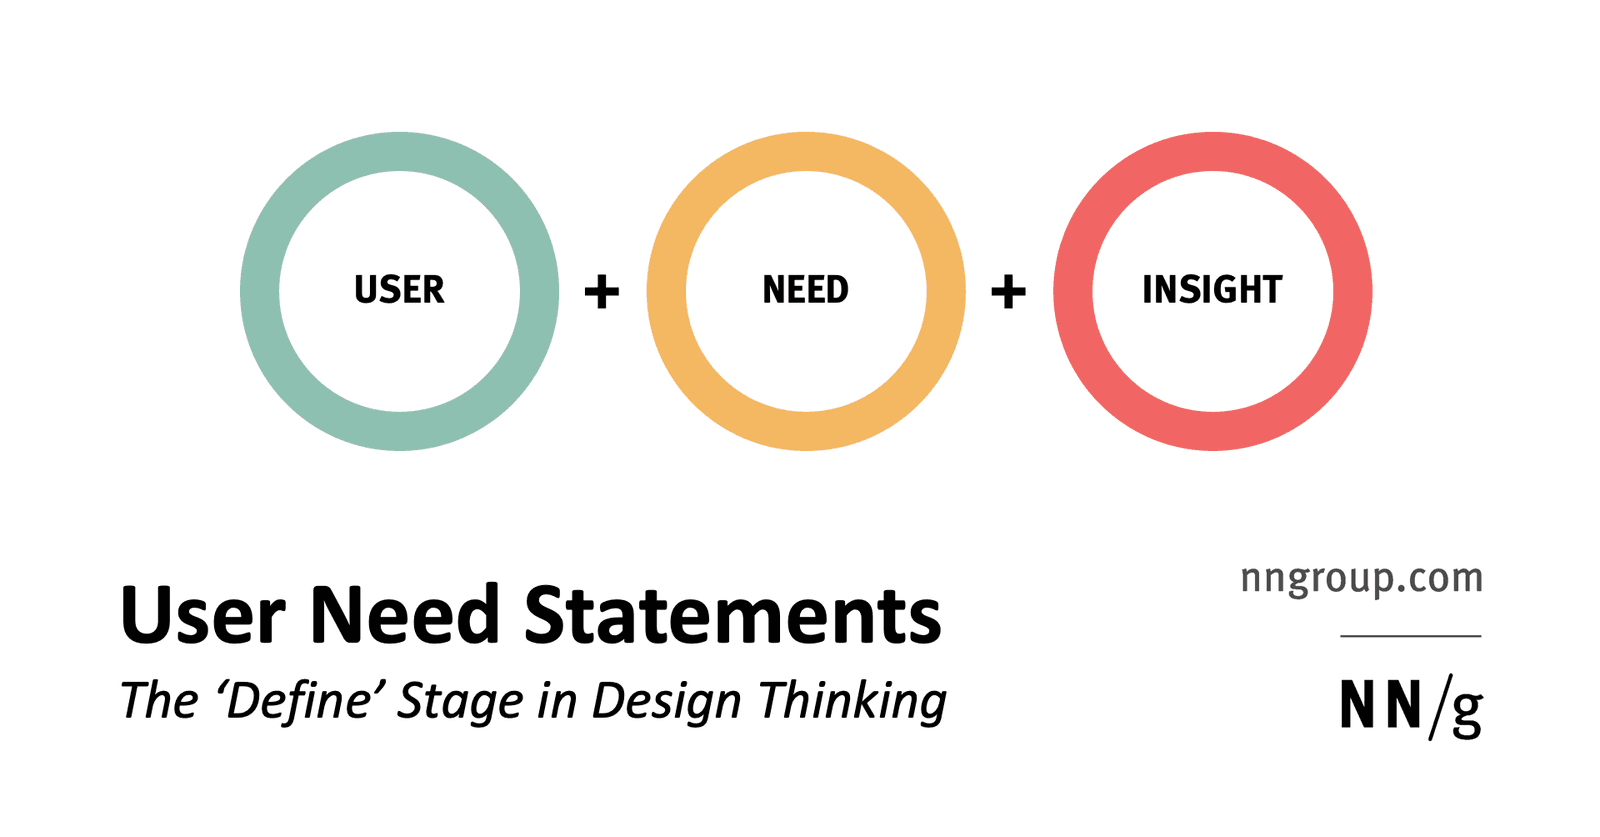
Insight Statements: Frame Problems, Not Solutions
Insight statements frame what users must achieve, not how. Teams use them in design thinking's define stage to align on the right problem before ideating. The footgun is writing solutions like 'needs a dashboard' instead of goals like 'needs to compare'.
Mental Model Diagram
A mental model diagram aligns what users think and do, gathered from research, against what a product actually offers, exposing gaps where features are missing or unused so teams build for real behavior rather than assumptions.
Narrative Analysis: How People Build Meaning
Narrative analysis treats life as an edited story; it reads journals and interviews for the meaning a person constructs, not raw facts. Use it when you need to understand why a belief formed. Never lift a quote from its story; context is the entire signal.
Grounded Theory: Build Theory from Raw Data
Grounded theory builds hypotheses from data, not from prior assumptions. UX researchers reach for it when exploring messy human behavior without existing models. The footgun: forcing early categories onto data instead of letting patterns emerge inductively.
Discourse Analysis in UX Research
Discourse analysis treats language as a design artifact, revealing how users construct meaning. Apply it to interviews and support logs to find unstated needs. Footgun: mining for confirming quotes rather than analyzing how the narrative is built.

Service Blueprint: The Wiring Diagram Behind User Journeys
A service blueprint X-rays the hidden machinery behind a customer journey. Use it for omnichannel services crossing departments. The footgun is producing generic diagrams untethered from a specific business goal like reducing redundancy.
Stevens' Four Levels of Measurement
Data is not just numbers; Stevens' levels classify the nature of information each variable holds. In UX research, this determines whether you can average feedback or only count it. Treating every rating scale as a ratio number wrecks your analysis.
We are hiring for this. Every open role lists the topics its interview covers, so you can prepare for the real thing rather than guessing.
See open roles