Advanced everything in Growth & Experimentation, page 2
Design a system that detects choice paralysis and dynamically simplifies the interface
Track hover entropy, scroll jitter, and time-to-click; use a contextual bandit to select simplification tiers.
How would you use ML to optimize habit-loop notifications?
Tests blending behavioral psychology and ML to personalize cues without coercion. Good answers use contextual bandits with user-state features and reward habit formation over clicks.
How would you instrument events and query a 3-invite aha moment?
Tests taxonomy and stateful aggregation across sessions. Strong answers instrument Teammate Invited with timestamps, compute 7-day per-user counts via stream or SQL windowing, and materialize cohorts.
Design a near real-time user interaction tracking and analytics system
Tests decoupling ingestion from querying with justified tech choices. Outline: client → Kafka → Flink → ClickHouse → API; budget sub-30s latency and backpressure per stage. Red flag: one monolithic RDBMS or batch ETL handling both writes and reads.
How do you architect a global notification holdback group?
Tests persistent control-group isolation without breaking critical flows. Strong answers use deterministic sticky bucketing by user ID, separate marketing and transactional namespaces, and audit holdout bleed.

Describe the architecture for multi-touch attribution with time-decay
Stitch IDs, stream events to warehouse, sessionize journeys, then apply decay weights in SQL.

How would you architect long-term holdback experiment groups?
Tests longitudinal causal inference and engineering tradeoffs for multi-month isolation. A strong answer covers bucketing, delayed metrics, and cross-experiment guards. Red flag: daily re-randomization or ignoring survivorship bias in aging cohorts.
The Traditional Career Ladder: A Single Path Up
The traditional career ladder is a single, vertical track for promotion, moving from entry-level to executive. It's common in large, established organizations with well-defined roles. The footgun is its rigidity, forcing experts into management to advance.

Growth Squads: Centralized vs. Decentralized
A growth squad is a trade-off between speed and cultural change. A centralized team optimizes for velocity with dedicated members, while a decentralized (embedded) team spreads the growth mindset by borrowing staff.
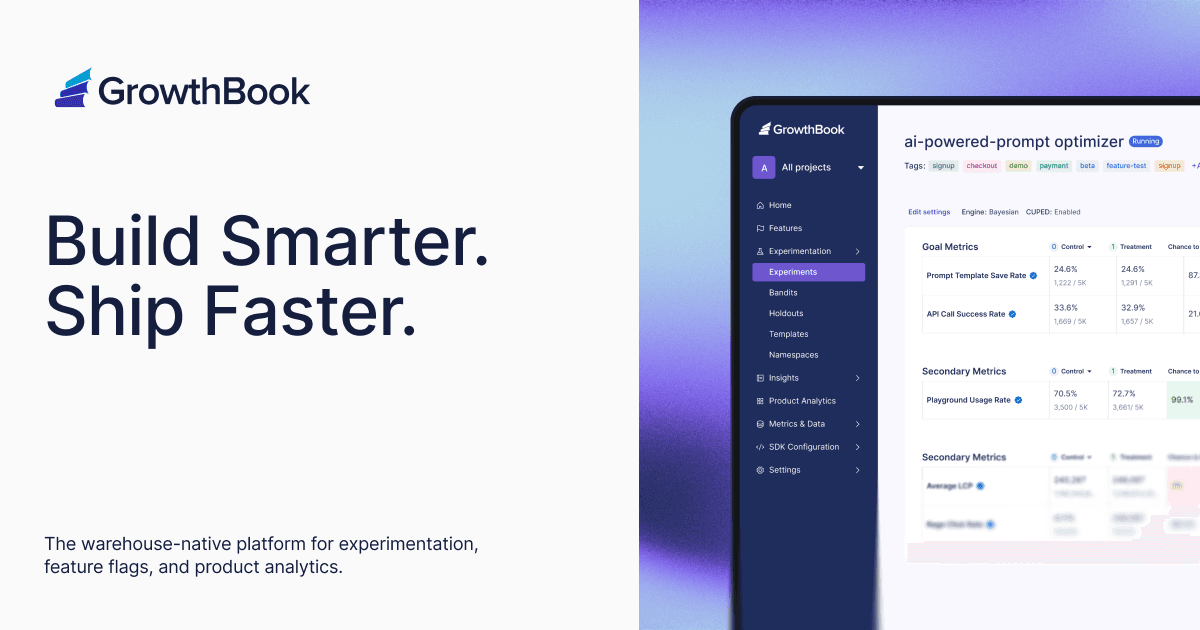
What is an Experimentation Stats Engine?
A stats engine is the brain of an A/B testing platform, turning raw data into reliable 'which version won?' decisions. It powers tools that analyze feature rollouts, ensuring statistical rigor.

Metrics Layer: The Dictionary for Your Data
A metrics layer is the central dictionary for your company's numbers, defining what "Revenue" or "Active User" means once for everyone. It ensures teams and AI agents get consistent answers from a single source of truth, preventing conflicting reports.
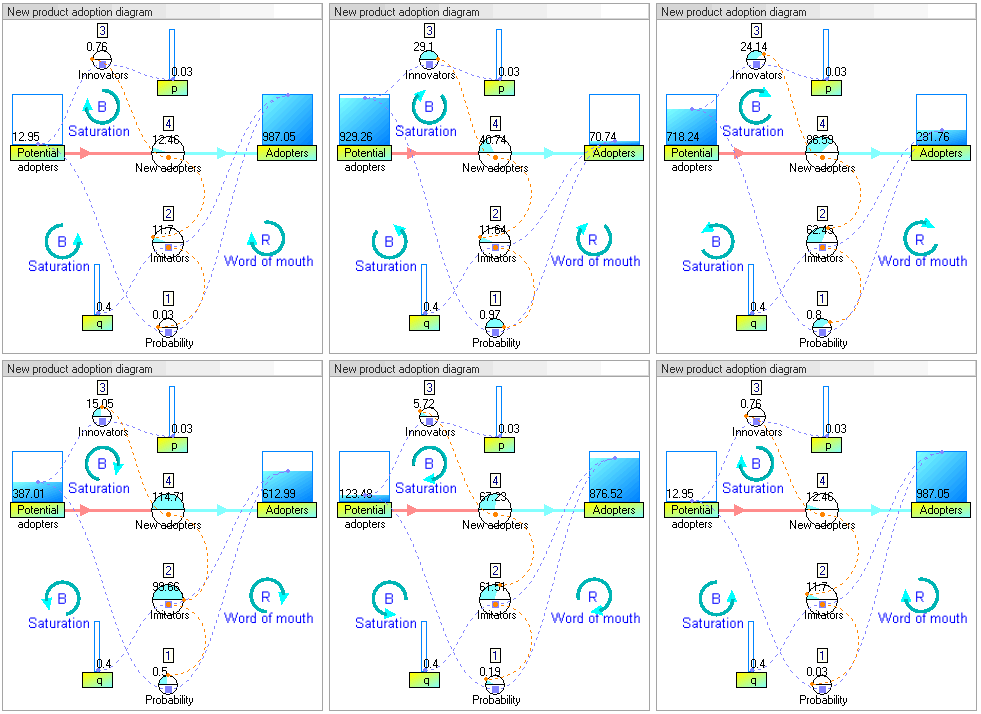
System Dynamics: Modeling with Stocks, Flows, and Feedback
System Dynamics models the world as interconnected stocks (like users) and flows (like signups), governed by feedback loops. Use it to understand why growth stalls or why hiring lags behind need.
Causal Impact: Measuring Effects Without an A/B Test
Causal Impact estimates an intervention's effect by modeling a 'what if' counterfactual. It's used to measure lift from a new feature or ad campaign when a clean A/B test isn't possible.
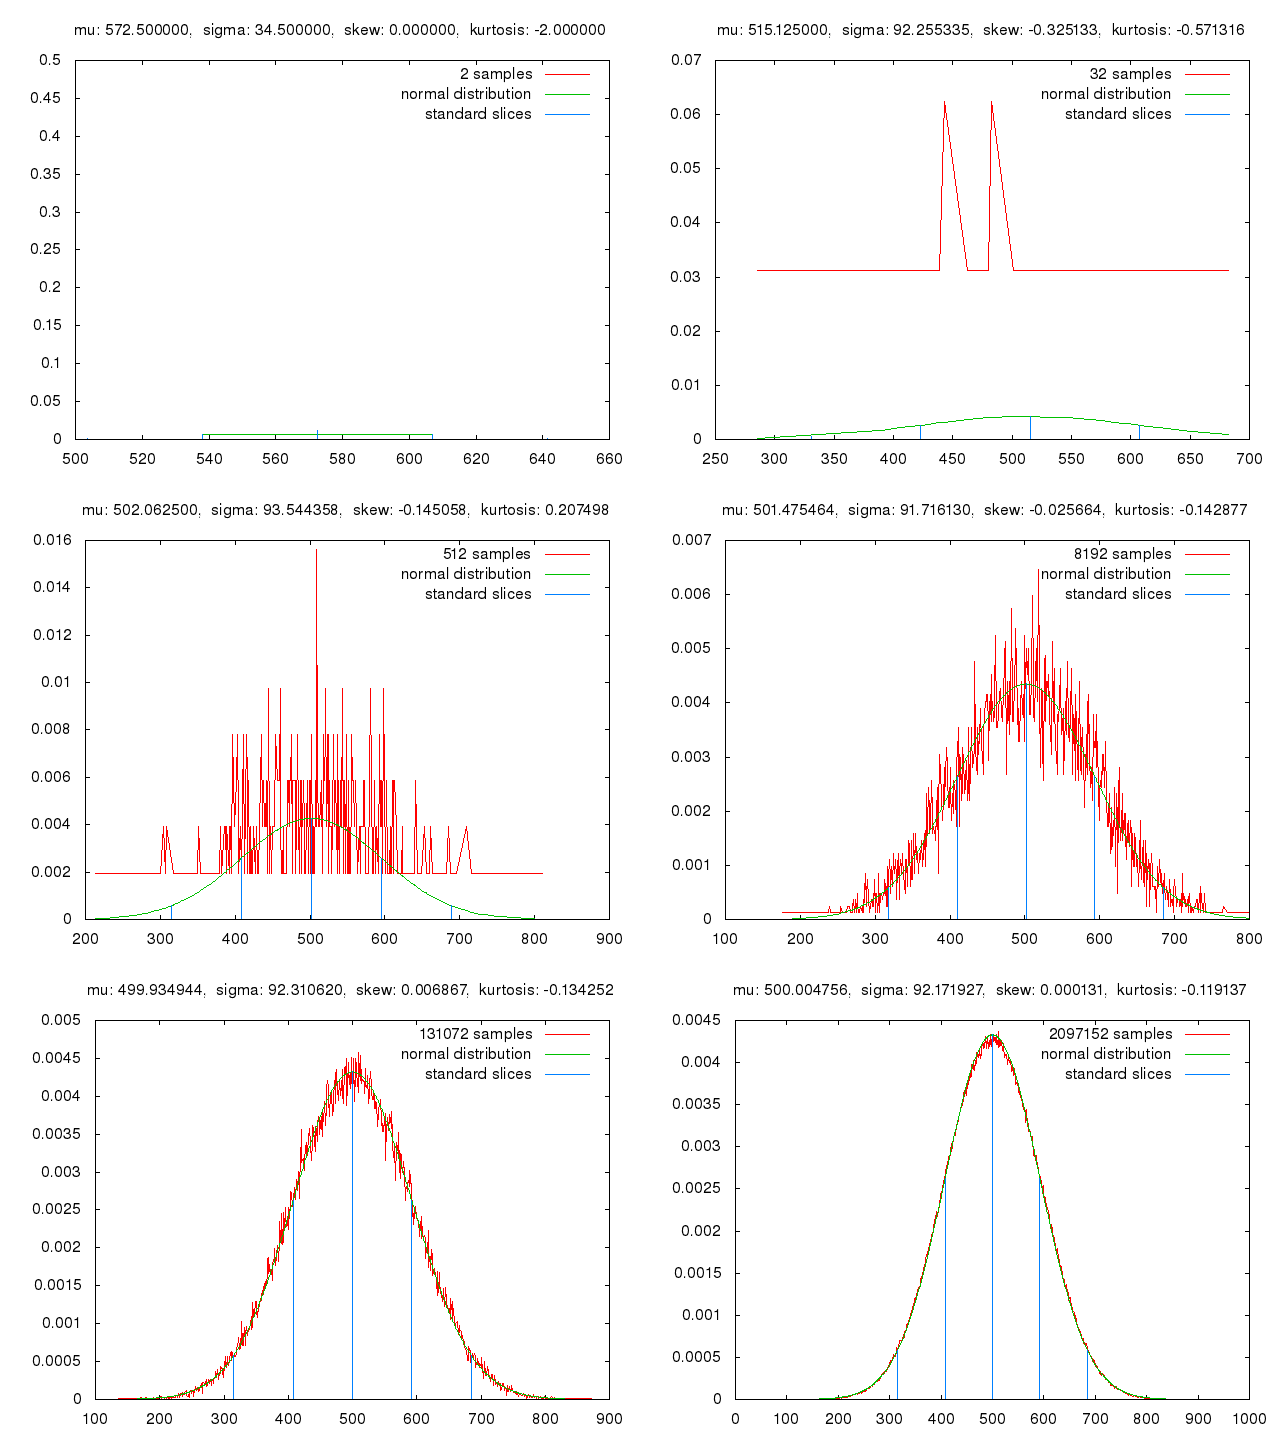
Forecasting with Monte Carlo Simulation
A Monte Carlo simulation forecasts outcomes by running thousands of 'what if' scenarios with random inputs. Use it to model complex systems like user growth with variable conversion rates.
Survival Analysis: Predicting When, Not Just If
Survival analysis predicts *when* an event like user churn will happen, not just *if*. It's used to model customer lifetime or hardware failure rates. The key mistake is using simple averages, which are skewed by users who haven't churned yet (censored data).
Entitlements: Use Feature Flags for Permanent Access Control
Entitlements use permanent feature flags to control long-term access, like a bouncer for your app's VIP section. This is how you manage premium tiers or special user permissions, ensuring the right customers always see the right features.
The Hybrid GTM Model: PLG Meets Enterprise Sales
A hybrid go-to-market model blends a self-serve product with a sales team, letting users start on their own and bringing in sales for big deals. B2B SaaS uses this for efficiency, but the footgun is creating friction if the handoff isn't seamless.
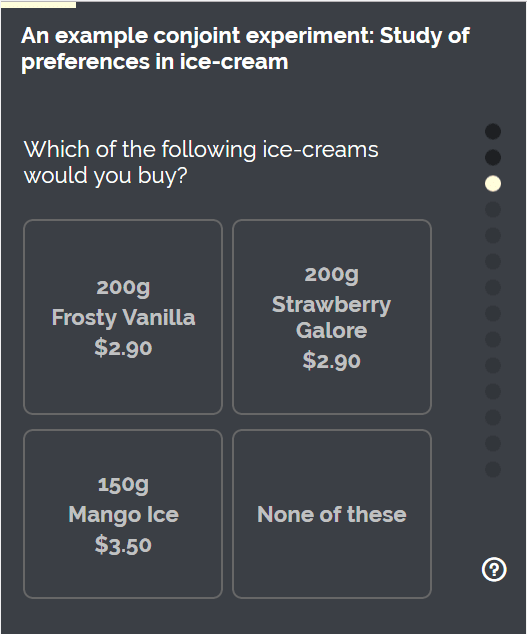
Conjoint Analysis: What Features Do Users *Really* Value?
Stop asking users what they want; make them choose. Conjoint analysis reveals true priorities by forcing trade-offs between product features, like price vs. battery life. It's used for pricing and roadmapping.
Price Elasticity: How Price Changes Affect Demand
Price elasticity measures how sensitive sales are to price changes. An elasticity of -2 means a 1% price increase causes a 2% drop in quantity sold. It's key for forecasting revenue from price tests, but the biggest footgun is assuming this ratio is constant.
Value-Based Pricing: Charge for Impact, Not Cost
Value-based pricing anchors your price to the customer's perceived benefit, not your production costs. It's used for unique goods like art or software where value is high. The main footgun is assuming value instead of researching customer willingness to pay.
We are hiring for this. Every open role lists the topics its interview covers, so you can prepare for the real thing rather than guessing.
See open roles