Concepts in Product Management, page 13

Choropleth Maps: Coloring Data by Region
A choropleth map colors geographic areas to represent a metric, like shading states red or blue on an election map. It's used to show regional data like population density or sales per territory.
Feature Toggles: Decouple Deployment from Release
A feature toggle is a runtime switch that lets you ship dormant code and activate it later, decoupling deployment from release. It enables canary rollouts and A/B tests.

Thematic Roadmaps: Focus on 'Why,' Not 'What'
A thematic roadmap organizes work around strategic goals ("themes") like "Improve User Onboarding," not just a feature list. It's used to align teams on high-level objectives and persuade executives. The footgun is mistaking a feature list for a strategy.

Streaks: Engineering Identity Through Loss Aversion
Streaks convert effort into identity, making users fear losing progress more than they enjoy extending it. Apps like Duolingo use this for daily engagement, but the footgun is when the streak itself becomes the goal, trapping users in a loop of loss aversion.

Lie Factor: Quantifying Visual Distortion in Graphs
The Lie Factor measures how much a graph's visuals distort the data's story. It's used to critique charts that exaggerate changes, like with a truncated y-axis.
Outcome-Based Roadmaps: Solve Problems, Not Ship Features
An outcome-based roadmap frames work around problems to solve, not a checklist of features to build. It gives teams autonomy to find the best solution for goals like increasing user engagement or improving conversion.
Notification Preference Center: Granular Control to Reduce Churn
A notification preference center gives users granular control, not just a global unsubscribe. It lets them choose what (updates vs. reminders), where (email vs. push), and how often (real-time vs.
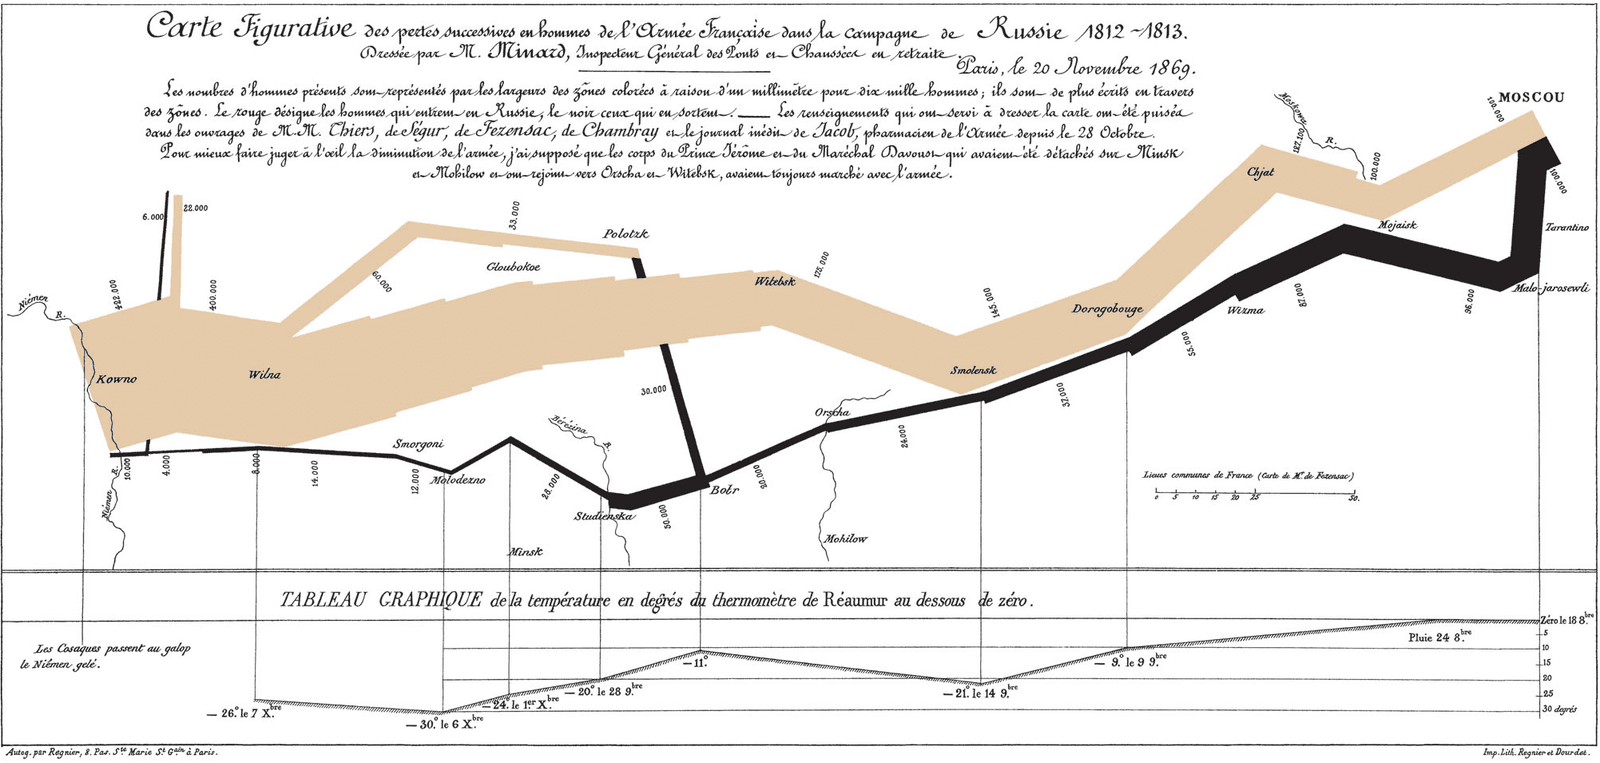
Exploratory Data Analysis (EDA): Look Before You Leap
Exploratory Data Analysis (EDA) is like being a detective with your data: you look for clues, patterns, and outliers before forming a theory. It's the first step in any data project, from building a model to creating a dashboard.
Emergent Architecture: Build Just Enough, Just in Time
Emergent architecture lets design evolve as you build, prioritizing adaptation over upfront planning. It's used in agile teams where requirements are unclear.
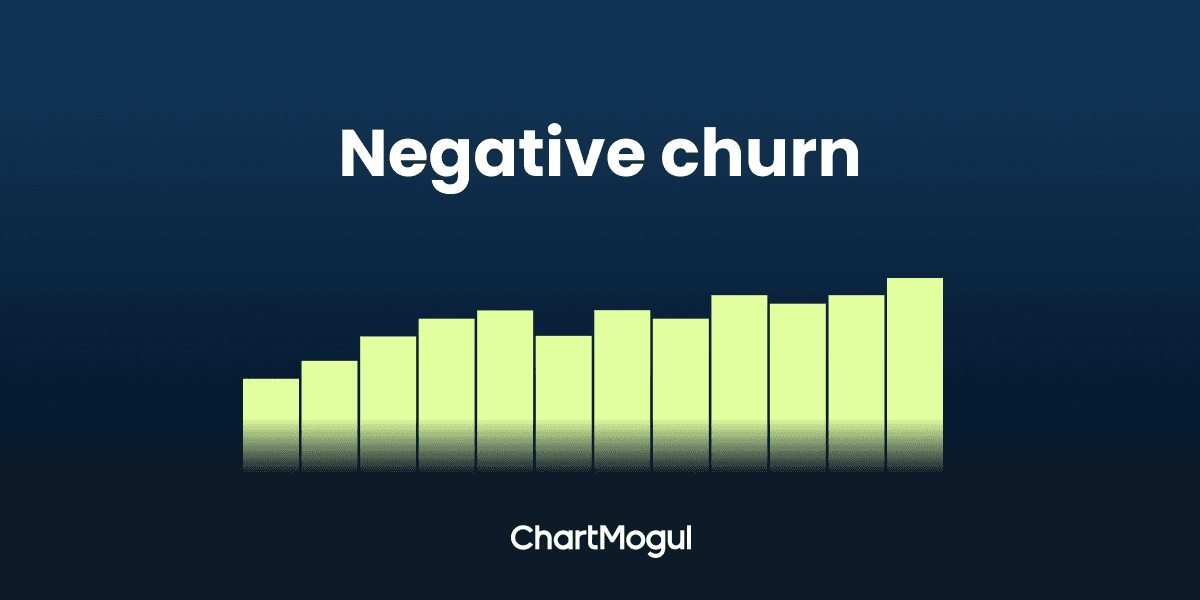
Negative Churn: When Losing Customers Still Means Growth
Negative churn means existing customers upgrade faster than others leave, growing your revenue even if you lose logos. It's a key SaaS metric for variable pricing models. The footgun: you can have negative revenue churn while still losing many customers.
Correlation Is Not Causation
Just because two metrics move together doesn't mean one causes the other. This is vital when analyzing user data, as a feature launch might correlate with higher signups when the real cause was a marketing campaign.
Continuous Delivery vs. Deployment: The Final Step
Continuous Delivery automates releases to a staging environment for a manual go-live decision, while Continuous Deployment automatically pushes every passing build to production. Use Delivery for business-timed releases; use Deployment for maximum velocity.
Roadmap Capacity Planning: Ideal vs. Reality
Capacity planning isn't about your team's ideal output (design capacity), but their actual output (effective capacity) after accounting for meetings, bugs, and on-call. Use it to build realistic roadmaps.
Customer Health Score: A Predictive Churn Signal
A Customer Health Score is like a credit score for customer loyalty, predicting churn risk. SaaS companies use it to focus retention efforts on at-risk accounts before they cancel. The footgun is using vanity metrics like logins over true value signals.
Root Cause Analysis: Stop Fixing Symptoms, Find the Source
Root Cause Analysis digs past surface-level symptoms to find the true origin of a problem. It’s used to analyze IT outages, manufacturing defects, and even medical misdiagnoses.
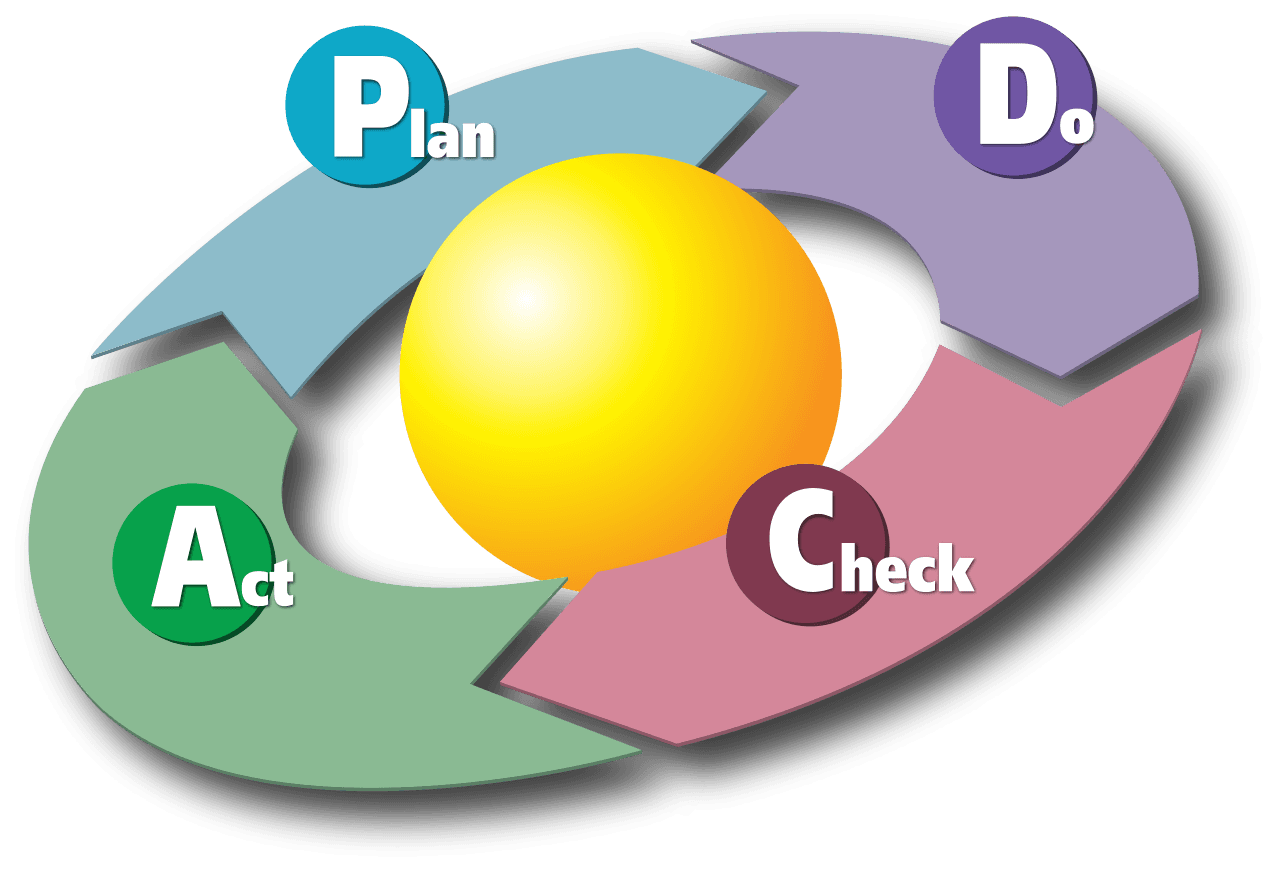
PDCA Cycle: The Scientific Method for Business Improvement
The PDCA cycle is the scientific method for business: Plan a change, Do the experiment, Check the results, and Act on the findings. It's used to refine manufacturing or improve software cycles.
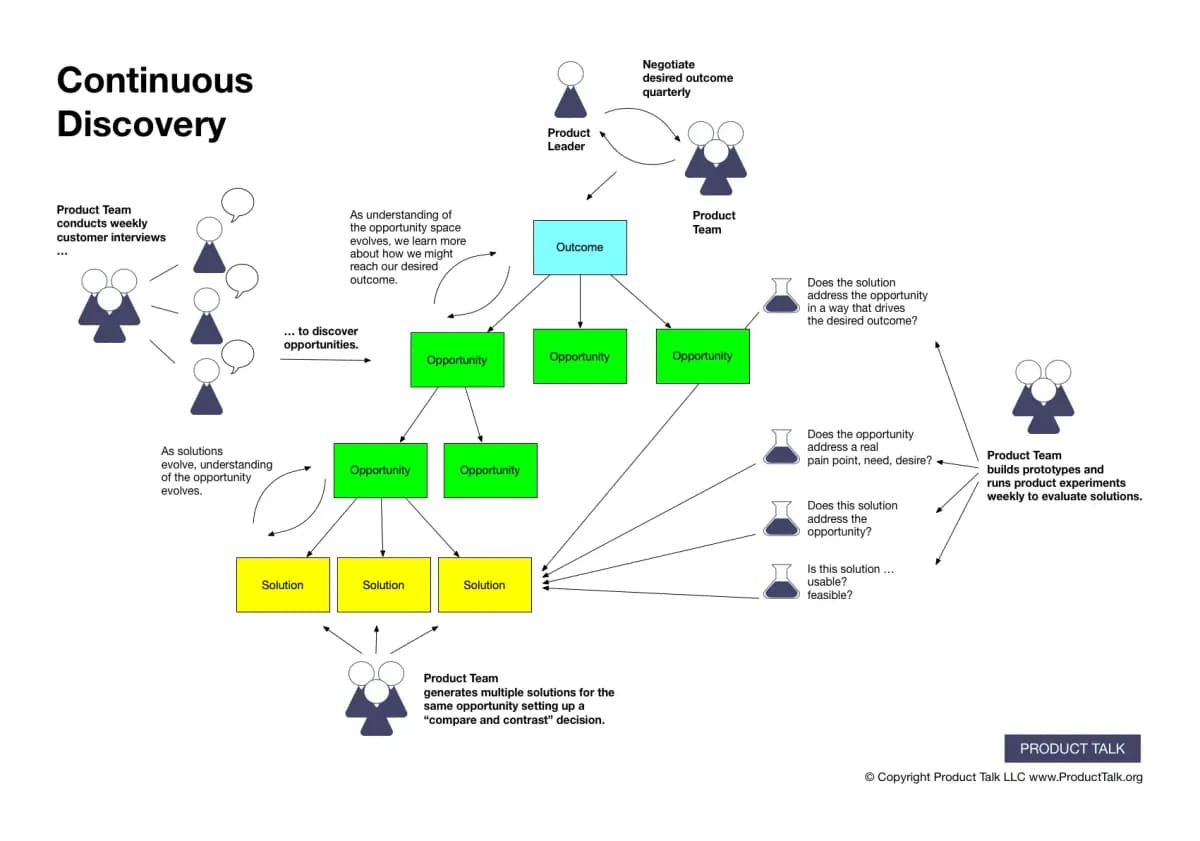
Continuous Discovery: Talk to Users Weekly, Not Yearly
Continuous discovery means small, weekly chats with customers, not a big upfront research phase. It's for teams building products that are never 'done,' like Netflix or your SaaS app. The footgun is treating discovery as a project, leading to stale insights.
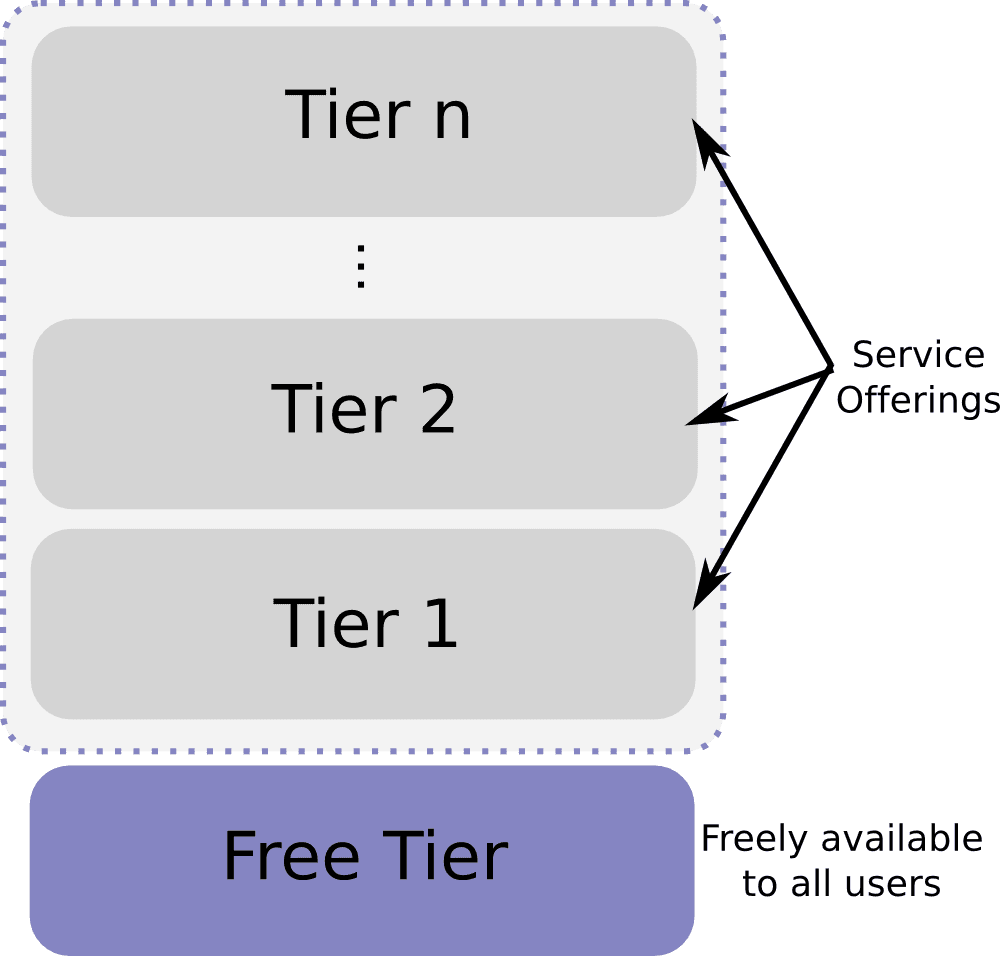
Freemium: Give Away the Basics, Sell the Upgrades
Freemium gives away a useful core product for free to attract a large audience, then sells premium features to a small subset of users. It's common in apps and games. The footgun is miscalibrating the free tier: make it too good and no one pays.
Statistical Significance: Is Your Result Real or Just Random?
Statistical significance checks if a result is a real effect or just random chance. It answers: 'How surprising is this data if my change had no effect?' It's used in A/B tests to validate new features. The footgun: a significant result isn't always important.
Retrospective Prime Directive: Assume Positive Intent
Assume everyone acted with the best intentions given their context. The Retrospective Prime Directive creates psychological safety for a blameless discussion, focusing on systemic issues, not individual fault.
We are hiring for this. Every open role lists the topics its interview covers, so you can prepare for the real thing rather than guessing.
See open roles