Intermediate concepts in Product Management, page 15
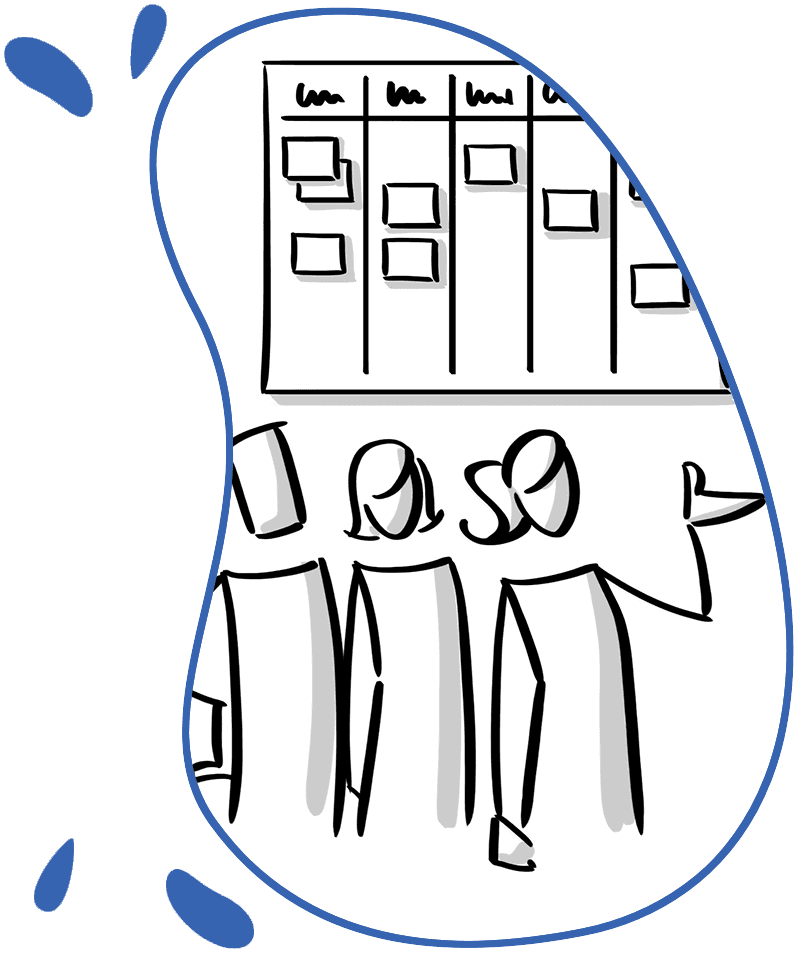
Kaizen: The Art of Continuous Improvement
Kaizen means "continuous improvement," making small, frequent changes instead of big, risky ones. In Scrum, this is the heart of the Sprint Retrospective, where teams inspect their process and define concrete actions for the next sprint.
Shu-Ha-Ri: A Model for Mastery
Shu-Ha-Ri is a model for mastery: first follow the rules (Shu), then break them (Ha), and finally make your own (Ri). It's used to guide agile adoption, starting with strict adherence before innovating.
Tracking Schema: Your Analytics Naming Convention
A tracking schema is the shared dictionary for your analytics, defining how you name user actions (events) and their details (properties). It's crucial for ensuring one team tracks "Song Played" the same way as another.
Scrum Master Stances: A Situational Toolkit
A Scrum Master isn't just a meeting facilitator. They're a situational leader who adopts different roles—teacher, coach, impediment remover—to serve the team. This toolkit helps them decide when to teach, when to coach, and when to clear a path for the team.

Period-over-Period Analysis: Measuring Change Over Time
Period-over-Period analysis answers 'Are we getting better?' by comparing metrics from consecutive time blocks, like this month's sales vs. last month's. The footgun is ignoring seasonality, which can create false signals of growth or decline.

Multivariate Testing: Finding the Best Combination
Multivariate testing (MVT) finds the best *combination* of changes, not just the best single change. It tests multiple elements at once, like three headlines and two button colors, to see how they interact.
Sprint Capacity Planning: Committing to Achievable Work
Sprint capacity planning is like checking your team's fuel tank before a road trip. It calculates your team's actual available work hours for a sprint, accounting for time off, to make a realistic commitment.
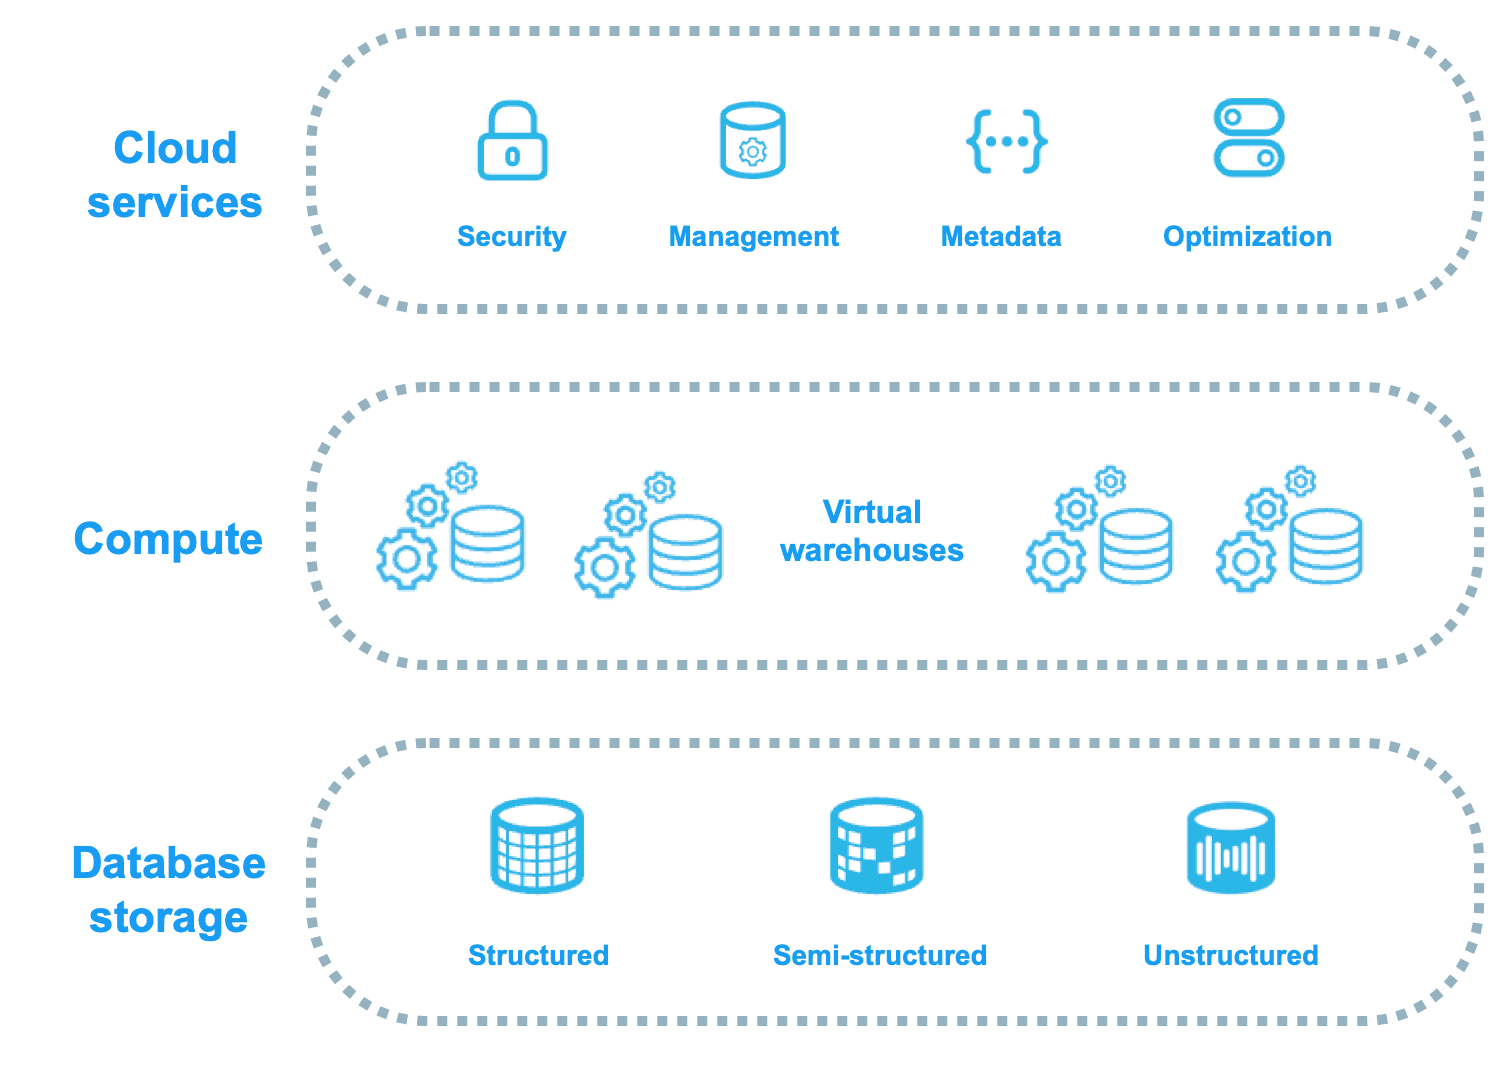
Snowflake: Decoupled Storage and Compute
Snowflake decouples storage from compute, acting like a shared-disk system for data management but a shared-nothing system for query performance. This lets you scale compute and storage independently, ideal for variable analytic workloads.
A3 Problem Solving: One Page to Clarity
A3 Problem Solving makes your thinking visible, using a single-page report to map the journey from a problem to a solution. It's used to diagnose bugs or strategic issues like falling market share. The footgun is using it when options are already decided.
Data-as-a-Product: Treat Your Data Like Software
Data-as-a-Product (DaaP) treats internal datasets like software, with owners, versions, and SLAs. This provides reliable, self-service data for consumers like analysts or other apps.
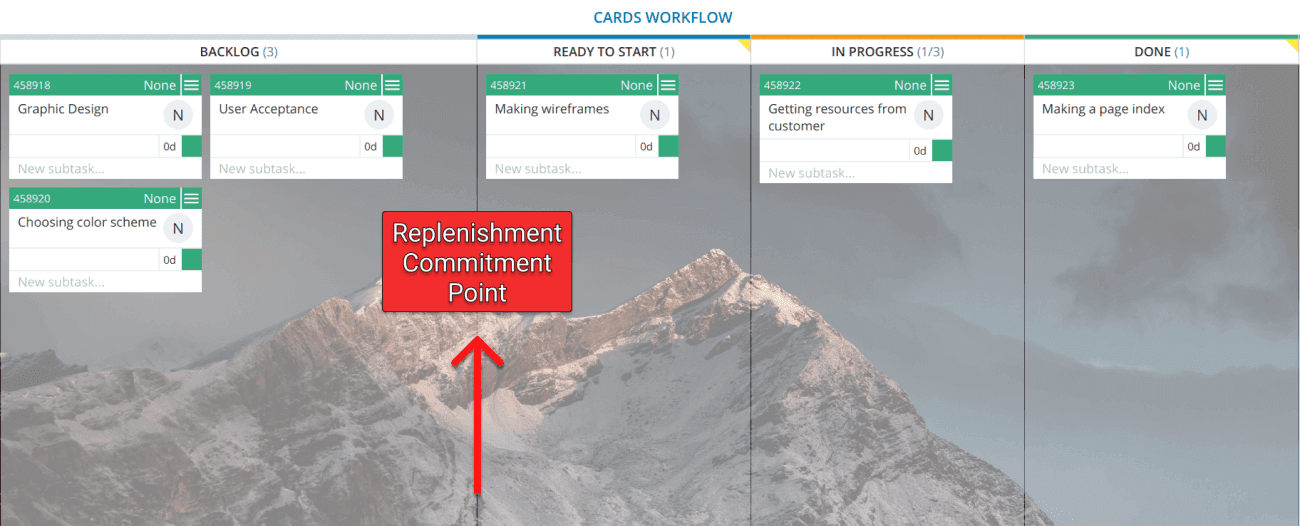
Kanban Replenishment: Pulling Work, Not Pushing It
Instead of a manager pushing tasks, a replenishment meeting is where the team pulls work into their active backlog. This cadence refills the 'Ready to Start' column, ensuring a steady flow of well-understood tasks.

Time to Value (TTV): From Signup to 'Aha!'
Time to Value (TTV) measures the time from a user's first touch to their first 'aha moment' of real value. It's crucial for optimizing onboarding and reducing churn. The main footgun is defining value from the company's view, not the customer's.

Work Item Age: Don't Let Your Tasks Spoil
Think of work item age as the time elapsed since a task started, like food in a fridge with an expiration date. Kanban teams use it to spot delays and bottlenecks. The biggest mistake is tracking age without acting on aging items to unblock them.

Analytics CoE: Centralizing Your Data Strategy
An Analytics Center of Excellence (CoE) is an internal data consulting group, centralizing experts to set standards and drive strategy. It helps large organizations standardize data quality and tooling. The footgun: becoming a bottleneck that slows teams down.
Agile Transformation Backlog: The Roadmap for Change
An Agile Transformation Backlog turns a vague vision for change into a concrete, prioritized to-do list for the entire organization. A dedicated team uses it to roll out new practices to specific departments, one small, measurable change at a time.

Data Dashboards: The Single-Page Business Story
A data dashboard is the executive summary for your metrics, telling a story on a single page with key visualizations. It consolidates data from multiple reports, providing a high-level view to monitor business performance.
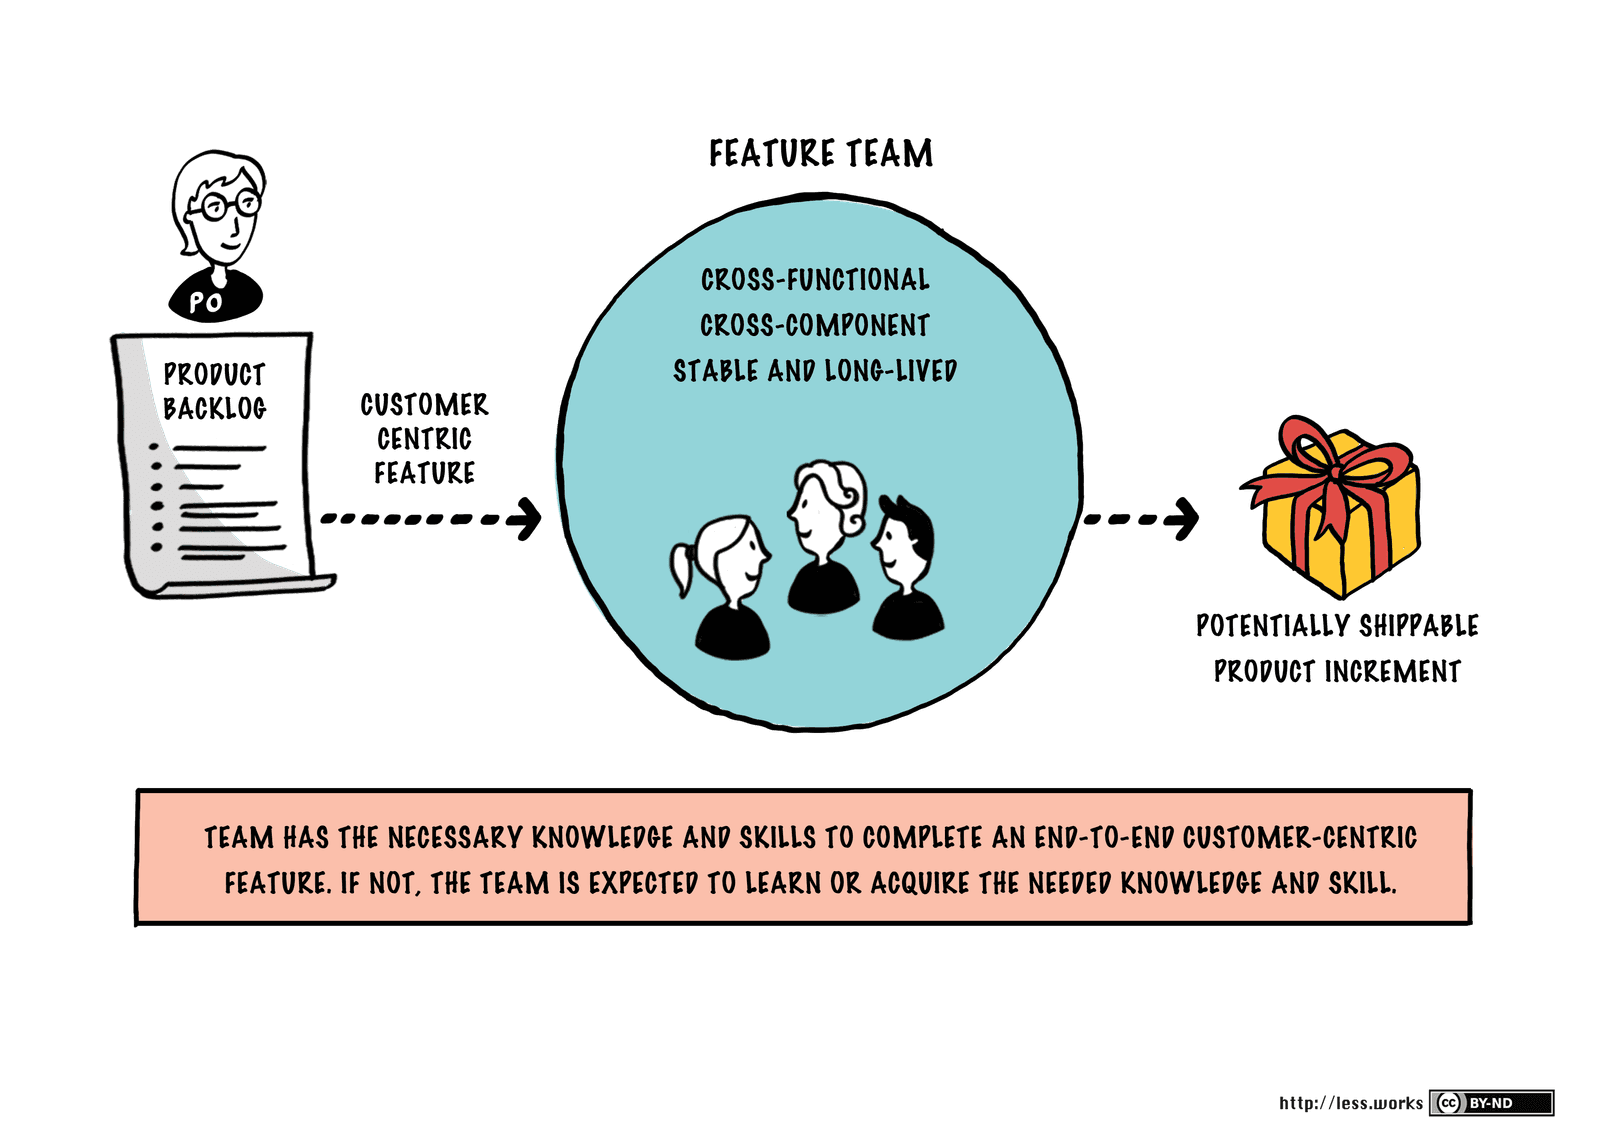
Feature Teams: Ship Value, Not Layers
A feature team owns a customer-facing feature from start to finish, unlike component teams that own a single tech layer. This reduces handoffs and speeds up delivery.

Color Theory: Guiding the Eye in Data Visualization
Color in a chart is a cognitive shortcut, telling the viewer's brain what to notice and how to feel. Use it to highlight trends (green for growth) or group categories. The footgun is using too many colors, which creates noise and obscures insights.
GSM: Connect Your Goals to Real Metrics
The GSM framework turns fuzzy goals into concrete numbers by linking what you want (Goal), to observable behaviors (Signal), to a specific measurement (Metric). It's used to define KPIs for new features. The footgun is choosing easy-to-measure vanity metrics.
Product Vision: The Why Behind Your What
A product vision is your team's North Star—an aspirational goal answering 'Why are we building this?' It guides the roadmap and aligns stakeholders by describing the future you're creating, ensuring everyone pulls in the same direction.
We are hiring for this. Every open role lists the topics its interview covers, so you can prepare for the real thing rather than guessing.
See open roles