Concepts in Product Management, page 14

Roadmap Commitment Levels: Now, Next, Later
Agile roadmaps replace fixed timelines with commitment levels: 'Now' (in progress), 'Next' (planned), and 'Later' (potential ideas). This structure communicates decreasing certainty, allowing teams to adapt without breaking promises.
Subscription Business Model: Renting Access, Not Selling Products
A subscription model rents access to a product instead of selling it, creating predictable, recurring revenue. It's common for digital goods like streaming services or SaaS.
P-value: Probability of Your Data, Not Your Hypothesis
A p-value measures how surprising your data is, assuming your null hypothesis (e.g., "no change") is true. It's used in A/B tests to decide if an effect is real. The footgun: a low p-value doesn't prove your theory, it just casts doubt on the null.
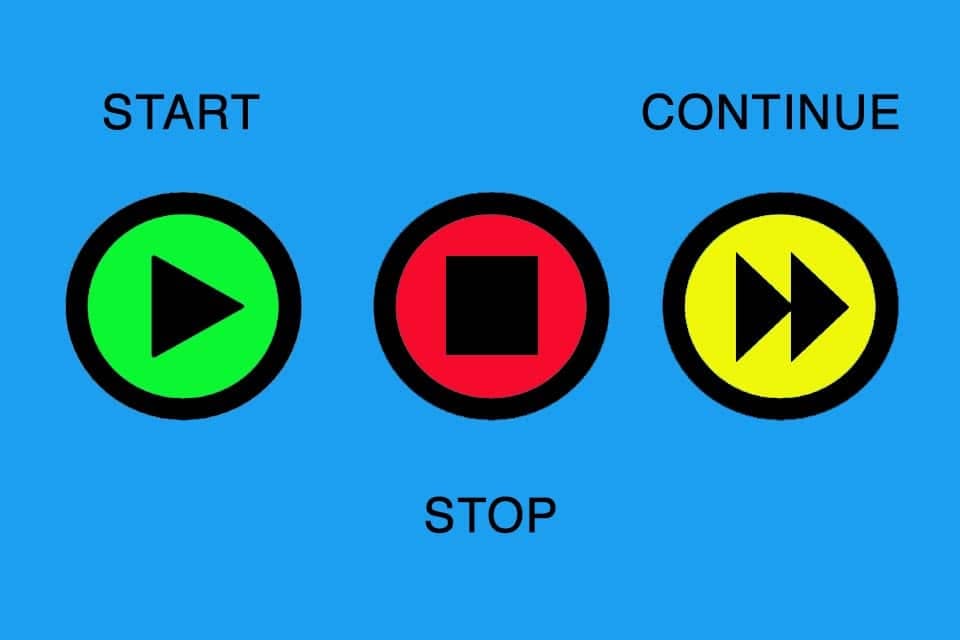
Start, Stop, Continue: A Simple Action-Oriented Retrospective
This retrospective turns feedback into action by asking what to start, stop, and continue doing. Teams use it after a sprint to improve processes and collaboration. The footgun: the 'Continue' list can become a long praise session, losing focus on improvement.
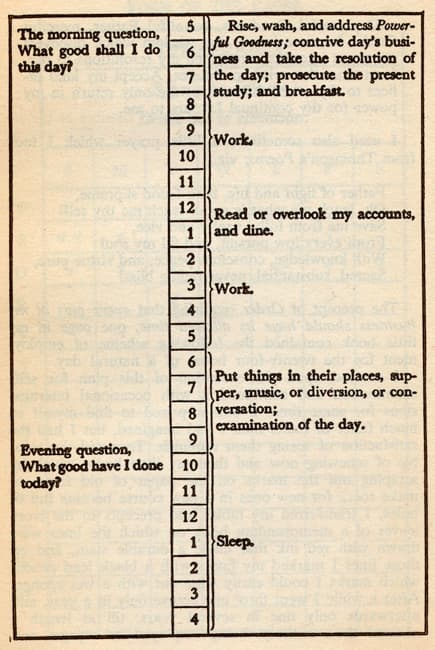
The Eisenhower Matrix: Urgent vs. Important
The Eisenhower Matrix sorts tasks by urgency and importance, not just deadlines. Use it for daily or weekly planning to focus on what truly moves the needle. The biggest footgun is letting 'urgent but not important' tasks dictate your day.
Average Revenue Per User (ARPU)
ARPU is the average revenue each user generates, a pulse check for a subscription business's health. It's used by media and SaaS companies to track if users are becoming more valuable, but it can be skewed by a few high-paying "whales."

Confidence Interval: Quantifying Uncertainty in Your Estimates
A confidence interval puts error bars around a measurement, showing the plausible range for a true value. It's used in A/B tests to report not just a winner, but the range of its likely impact.
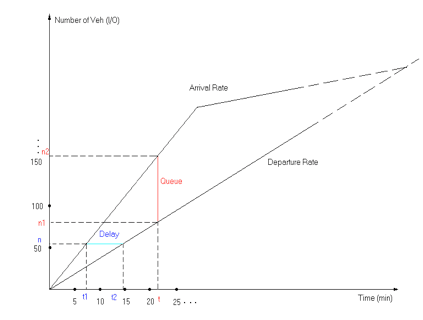
Cumulative Flow Diagrams: Spotting Workflow Bottlenecks
A Cumulative Flow Diagram is a geological cross-section of your project, showing work moving through states over time. Agile teams use it to spot bottlenecks by seeing where tasks pile up. The footgun is misinterpreting a widening band as a failure.
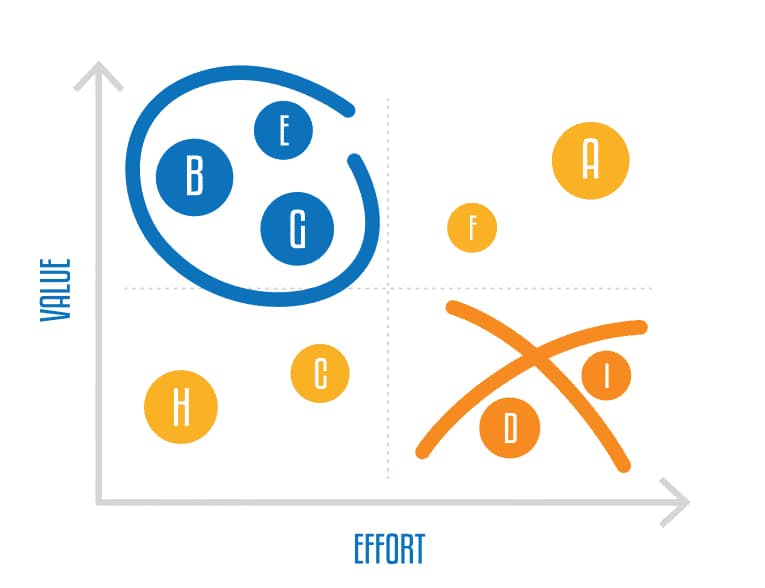
Value vs. Effort Matrix: Prioritize What to Build Next
A Value vs. Effort matrix is a 2x2 grid for deciding what to build, plotting features by their potential value against implementation complexity. Product teams use it to prioritize roadmaps and justify resource allocation.

Tiered Pricing: One Product, Many Prices
Tiered pricing sells one product at multiple prices by packaging features for different customer needs. It's common in SaaS (Basic, Pro, Enterprise plans) and telecoms.
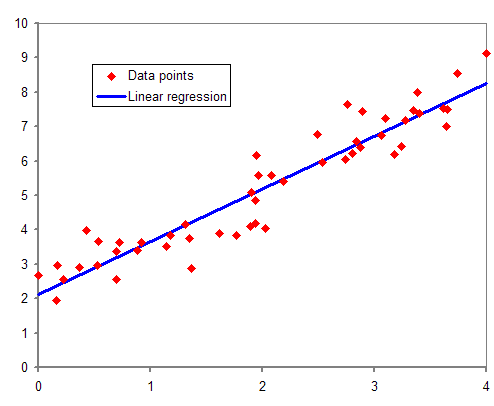
Regression Analysis: Finding the Line of Best Fit
Regression analysis draws a line through data to model relationships between variables. Use it to predict a house price from its square footage or forecast sales from ad spend. The footgun: a strong correlation doesn't prove one variable causes the other.

Fishbone Diagram: Mapping Problems to Root Causes
A fishbone diagram maps a problem to its potential root causes. It's a structured brainstorming tool used in retrospectives or post-mortems to explore *why* something happened.
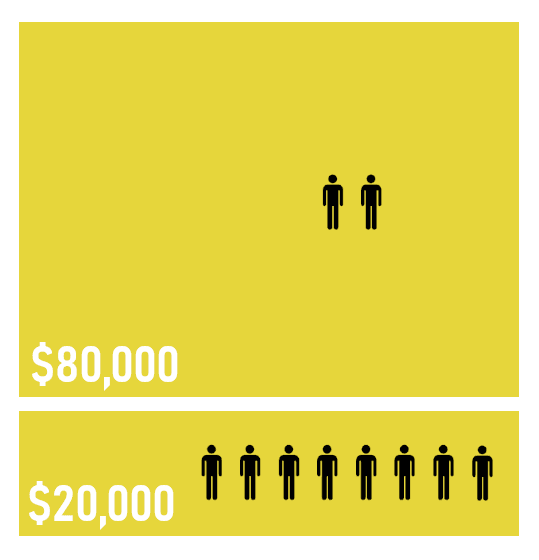
The 80/20 Rule: Find the Vital Few
The 80/20 rule states that most outcomes (80%) come from a few causes (20%). It's used to find high-impact work, like fixing the few bugs causing most crashes. The footgun is treating 80/20 as a precise law instead of a general heuristic.

Usage-Based Pricing: Pay for Value, Not Seats
Usage-based pricing links cost directly to consumption, letting customers pay for what they use instead of a flat fee per user. It's common for cloud services (AWS) and APIs where value isn't tied to seats.
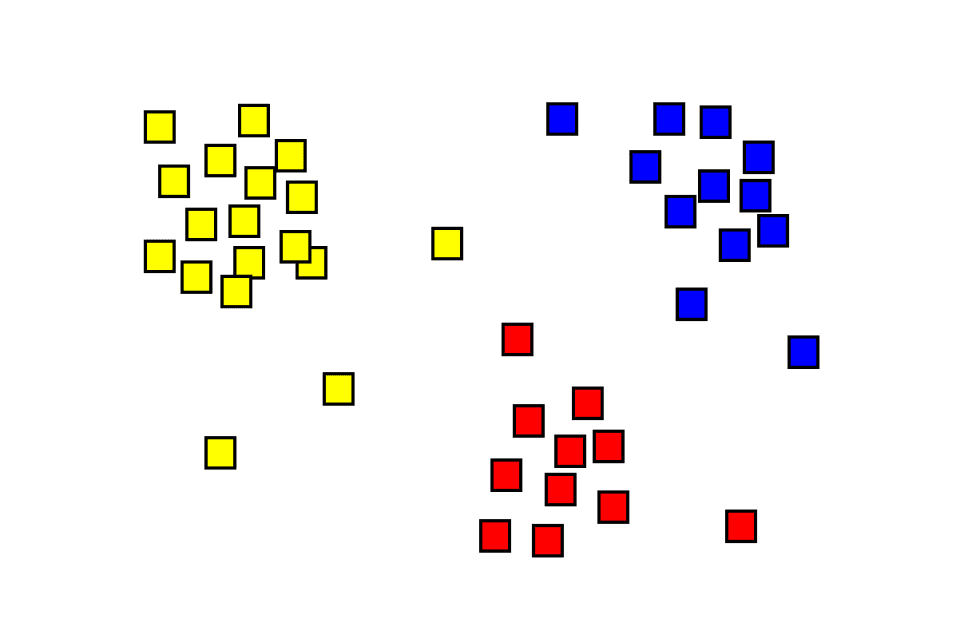
Cluster Analysis: Finding Hidden Groups in Your Data
Cluster analysis automatically finds natural groupings in unlabeled data, like sorting a mixed bag of Legos without a manual. It's used for customer segmentation or anomaly detection.

SMART Goals: From Vague Hopes to Actionable Plans
SMART criteria turn vague hopes into concrete plans by forcing goals to be Specific, Measurable, Achievable, Relevant, and Time-bound. It's used in project planning and performance reviews.
Scope Creep: When 'Just One More Thing' Derails a Project
Scope creep is the uncontrolled growth of a project's requirements after it starts. It shows up as 'small tweaks' that balloon into major features, delaying schedules and increasing costs. The footgun is trying to prevent it entirely instead of managing it.
Value-Based Pricing: Charge for Impact, Not Cost
Value-based pricing anchors your price to the customer's perceived benefit, not your production costs. It's used for unique goods like art or software where value is high. The main footgun is assuming value instead of researching customer willingness to pay.
Outlier Detection: Finding Data That Doesn't Belong
Outlier detection finds data points that don't fit the pattern, signaling an error, fraud, or a new event. It's used to spot faulty sensor readings or fraudulent transactions.
Radical Candor: Care Personally, Challenge Directly
Radical Candor is a feedback framework that combines caring personally with challenging directly. It's used to give clear, kind guidance—both praise and criticism—that helps people grow.
We are hiring for this. Every open role lists the topics its interview covers, so you can prepare for the real thing rather than guessing.
See open roles