More in Product Management — page 62

Growth Squads: Centralized vs. Decentralized
A growth squad is a trade-off between speed and cultural change. A centralized team optimizes for velocity with dedicated members, while a decentralized (embedded) team spreads the growth mindset by borrowing staff.
OKRs: Frame Growth Goals as Measurable Outcomes
OKRs separate your ambitious goal (Objective) from the measurable results that prove you're there (Key Results). Growth teams use this to align on what success looks like.
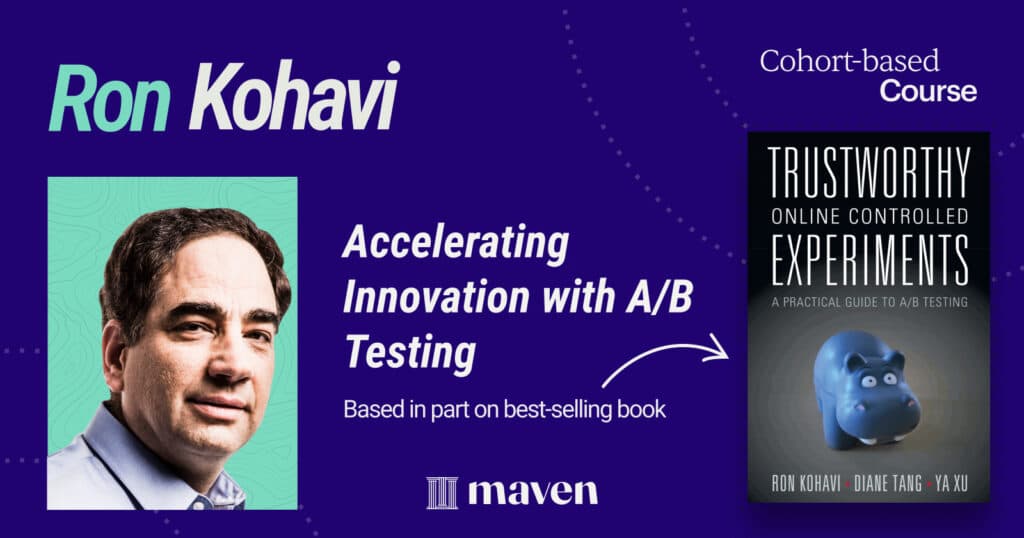
Experiment Knowledge Base: Don't Repeat Failed Tests
An Experiment Knowledge Base is your company's collective memory for A/B tests, centralizing hypotheses, results, and learnings. It prevents re-running old tests and surfaces past insights.
The Independent Growth Team Model
An independent growth team is a startup-within-a-company, given autonomy to run experiments across the funnel. Use it to break silos and accelerate learning. The main footgun is isolation, creating a rogue unit whose wins are difficult to integrate.
Growth Meeting Cadence: Focus on Learnings, Not Updates
Run your weekly growth meeting like a learning synthesizer, not a status report. Focus on extracting insights from experiments to drive future impact. The biggest mistake is wasting time on "what" you're doing; handle status updates asynchronously.
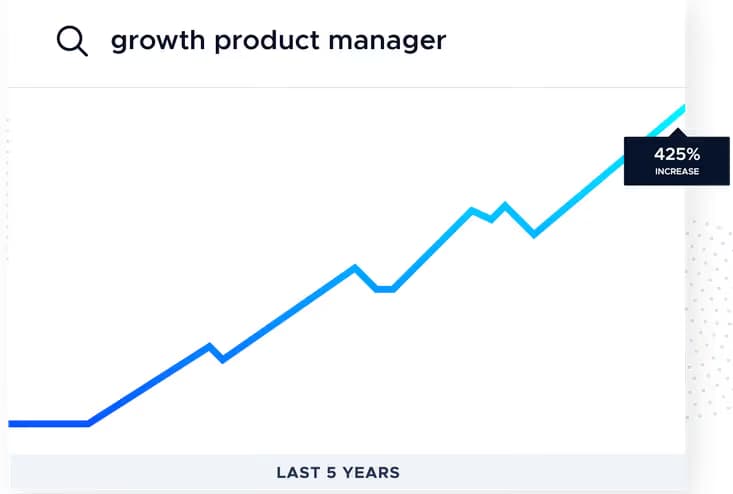
Growth Product Manager: Driving Metrics, Not Just Features
A Growth PM is a business optimizer for an existing product. They focus on moving a single metric like user activation or retention, often through rapid experimentation. This role is key in product-led companies where the product must sell itself.
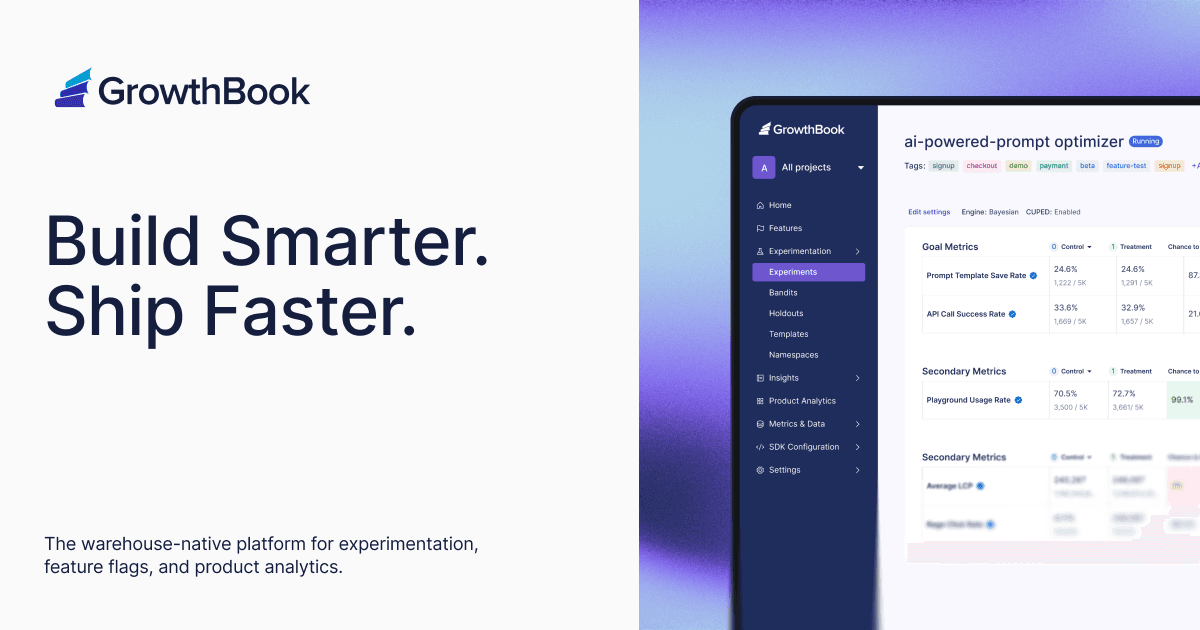
What is an Experimentation Stats Engine?
A stats engine is the brain of an A/B testing platform, turning raw data into reliable 'which version won?' decisions. It powers tools that analyze feature rollouts, ensuring statistical rigor.

Metrics Layer: The Dictionary for Your Data
A metrics layer is the central dictionary for your company's numbers, defining what "Revenue" or "Active User" means once for everyone. It ensures teams and AI agents get consistent answers from a single source of truth, preventing conflicting reports.

Server-Side Experimentation: Testing Your Backend Logic
Server-side experimentation renders A/B test variations on the server before sending the page. Use it for testing deep backend logic like search algorithms or to avoid the visual 'flicker' of client-side tests. The footgun: it requires developer cycles.
Feature Management: Control Releases After You Deploy
A feature management platform decouples code deploys from feature releases. It centralizes control over who sees what, turning simple code toggles into a powerful system for canary releases, A/B tests, and targeted rollouts, all from a UI.

ETL vs. ELT: When to Transform Your Data
ETL (Extract, Transform, Load) preps data before storage, like a chef prepping ingredients. ELT loads raw data first, transforming it inside the warehouse. Use ETL for structured reporting; use ELT for flexibility with raw data.
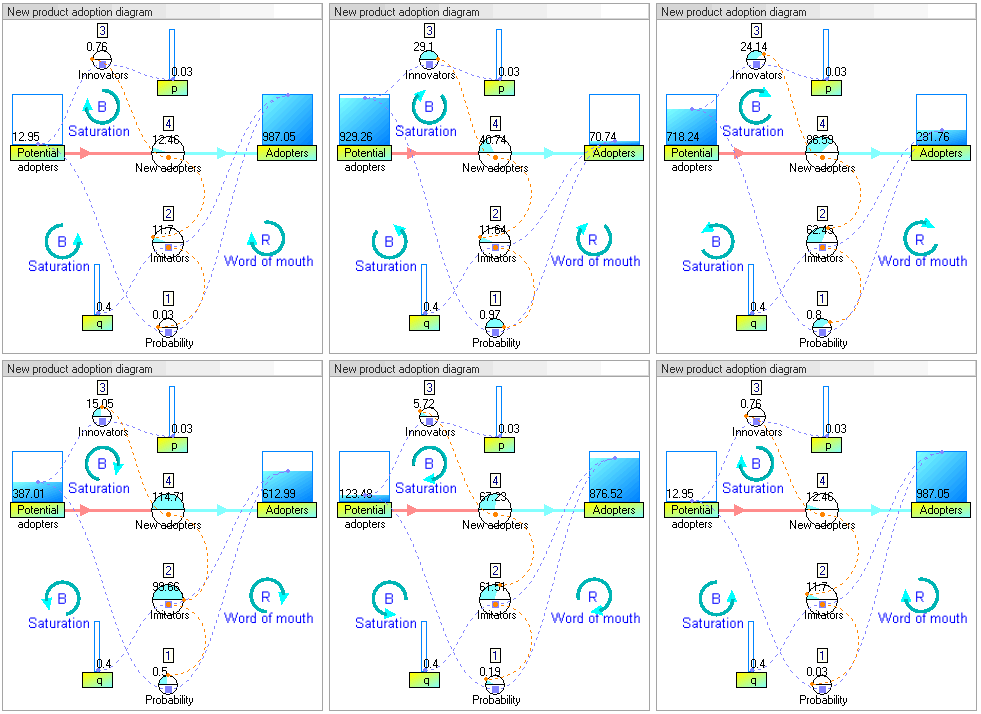
System Dynamics: Modeling with Stocks, Flows, and Feedback
System Dynamics models the world as interconnected stocks (like users) and flows (like signups), governed by feedback loops. Use it to understand why growth stalls or why hiring lags behind need.
Causal Impact: Measuring Effects Without an A/B Test
Causal Impact estimates an intervention's effect by modeling a 'what if' counterfactual. It's used to measure lift from a new feature or ad campaign when a clean A/B test isn't possible.
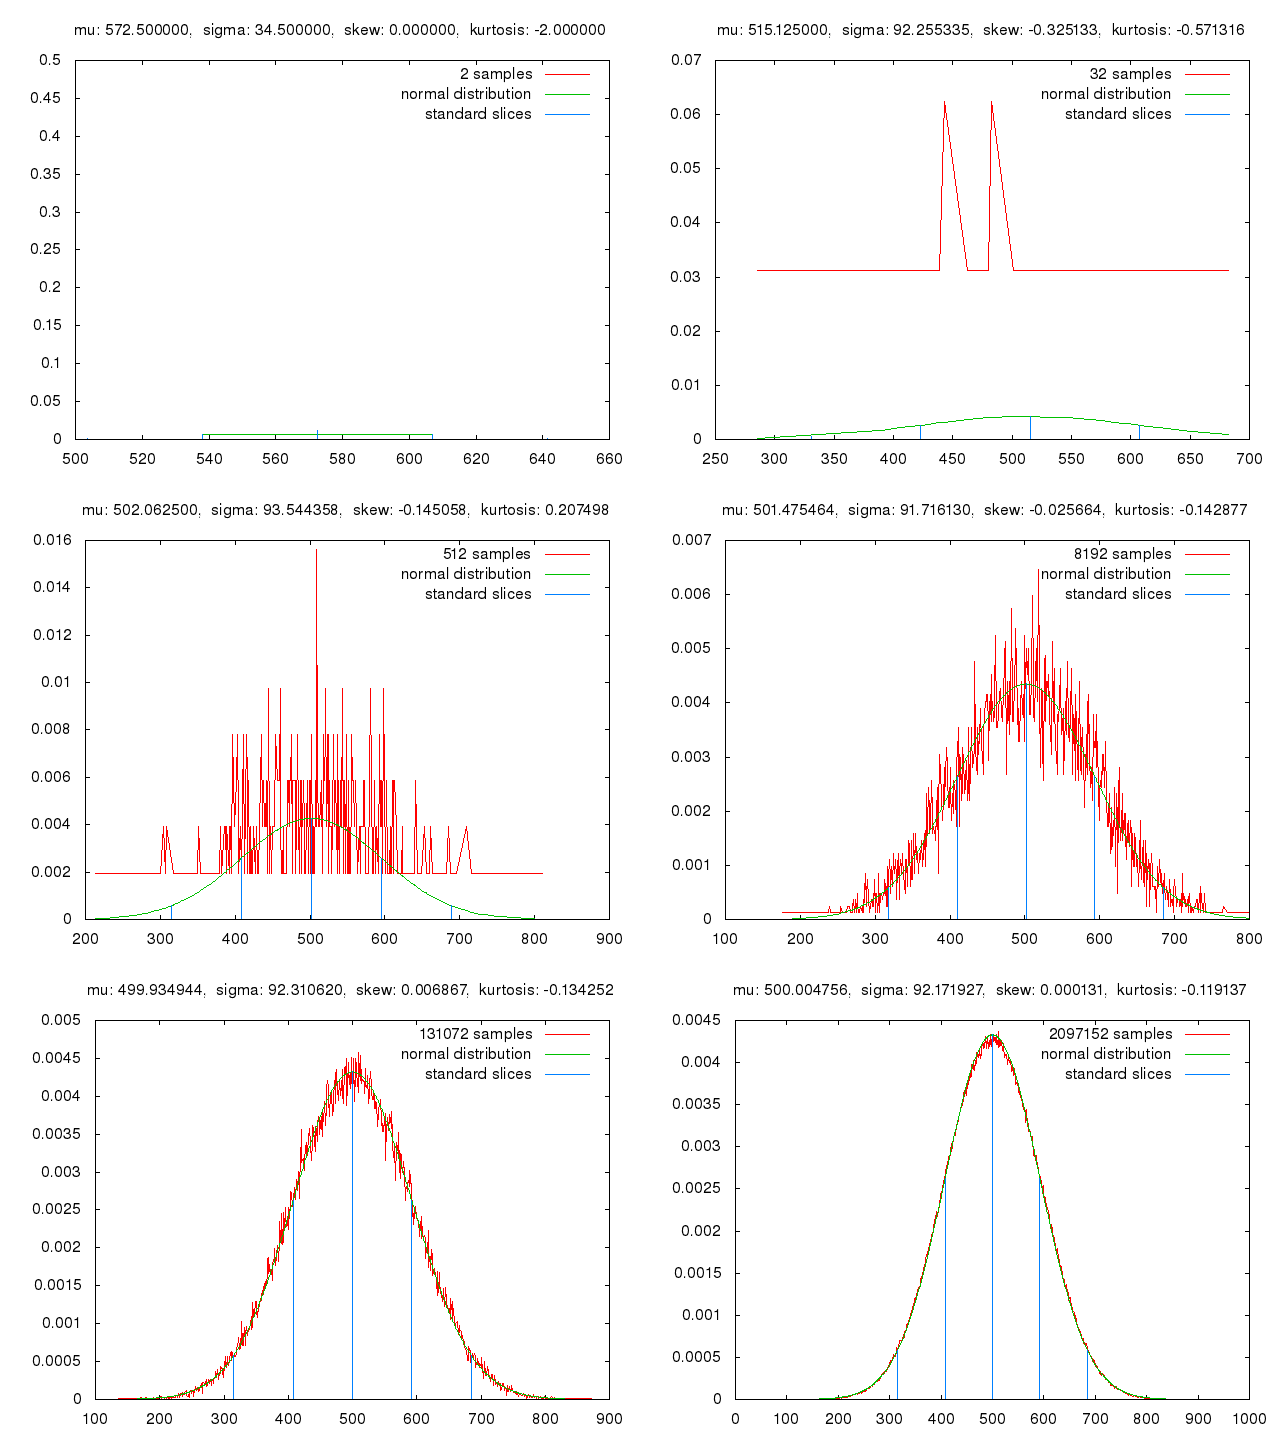
Forecasting with Monte Carlo Simulation
A Monte Carlo simulation forecasts outcomes by running thousands of 'what if' scenarios with random inputs. Use it to model complex systems like user growth with variable conversion rates.
Survival Analysis: Predicting When, Not Just If
Survival analysis predicts *when* an event like user churn will happen, not just *if*. It's used to model customer lifetime or hardware failure rates. The key mistake is using simple averages, which are skewed by users who haven't churned yet (censored data).

Prophet: Time Series Forecasting for Seasonal Data
Prophet treats a time series as a sum of its parts: a long-term trend, seasonal cycles, and holidays. It's used for business forecasting, like predicting sales, when you have strong seasonal data. The footgun is using it for non-seasonal data.
The Bass Diffusion Model: Innovators vs. Imitators
The Bass Diffusion Model splits product adoption into innovators who buy first and imitators who follow the crowd, creating the classic S-curve of growth. It's used to forecast sales for new products by modeling how word-of-mouth drives adoption.
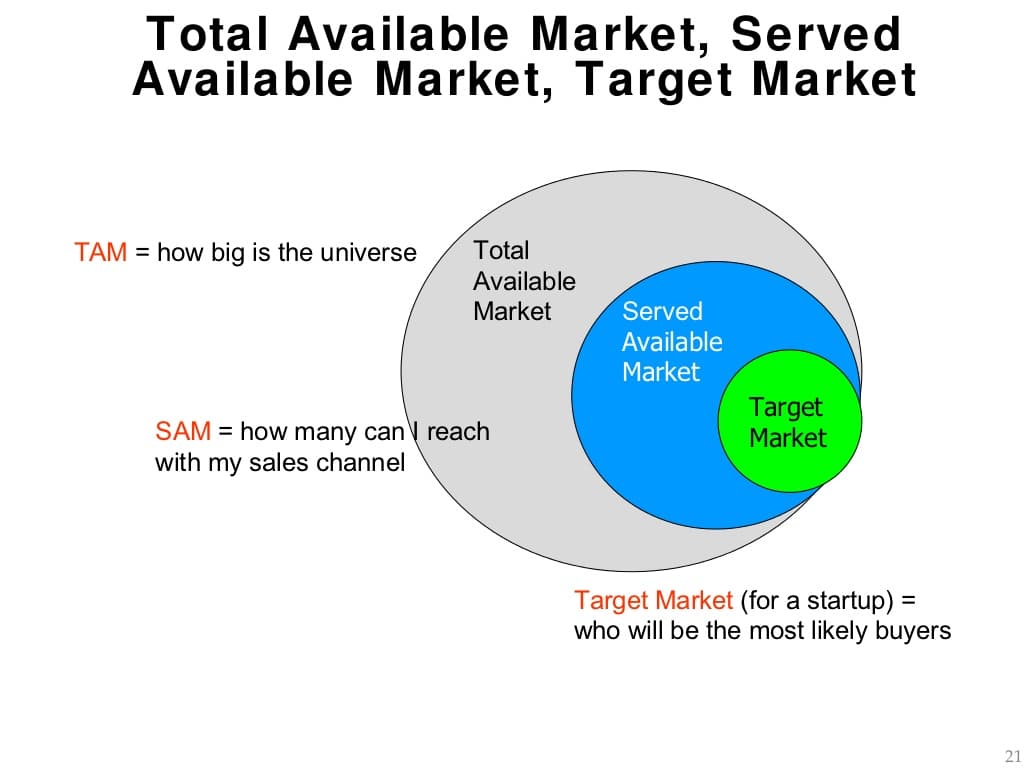
Market Sizing: TAM, SAM, and SOM for Realistic Planning
Market sizing is a funnel, not a single number. TAM is the total universe of customers, SAM is the segment you can reach, and SOM is who you can realistically win. It's crucial for business plans and investor pitches.
Linear Regression: Forecasting with a Straight Line
Linear regression forecasts the future by drawing a straight line through past data. It's used to predict outcomes like sales based on ad spend or energy use based on temperature.
Growth Accounting: What's Really Driving Your Growth?
Growth accounting splits your growth into two parts: adding more resources (like ad spend) and getting better with what you have. Use it to see if growth came from a bigger budget or a better product.